
- Start >
- Meteorology >
- Global radiation >
- Isar >
- Puch >
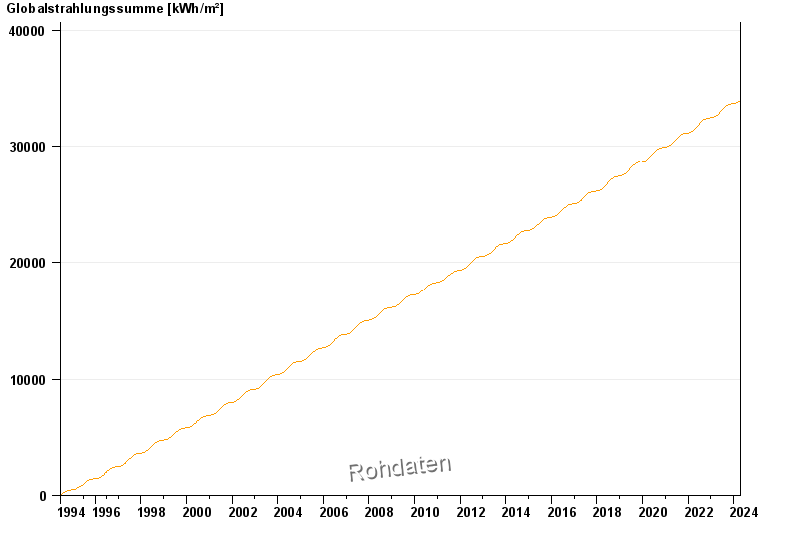
- Chart of total period

Chart of total period Puch
Global radiation from 24.06.1994 to 19.04.2024
Note: The time series in the selected period has gaps.
| Date | Global radiation [Wh/m²] |
|---|---|
| 19.04.2024 | 2478.7 |
| 18.04.2024 | 2056.2 |
| 17.04.2024 | 2567.7 |
| 16.04.2024 | 4868.0 |
| 15.04.2024 | 1609.4 |
| 14.04.2024 | 5727.9 |
| 13.04.2024 | 5794.5 |
© Bayerisches Landesamt für Umwelt 2024