
- Start >
- Meteorology >
- Global radiation >
- Isar >
- Bergham >
- Chart of total period

Chart of total period Bergham
Global radiation from 06.05.2009 to 16.04.2024
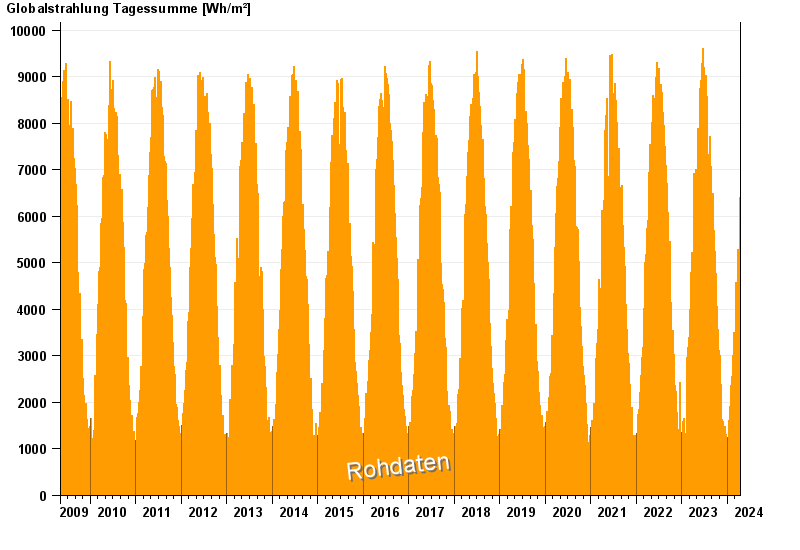
Note: The time series in the selected period has gaps.
| Date | Global radiation [Wh/m²] |
|---|---|
| 16.04.2024 | 4853.0 |
| 15.04.2024 | 1515.9 |
| 14.04.2024 | 6428.2 |
| 13.04.2024 | 6257.7 |
| 12.04.2024 | 6415.4 |
| 11.04.2024 | 5427.2 |
| 10.04.2024 | 3544.5 |
© Bayerisches Landesamt für Umwelt 2024