
- Start >
- Meteorology >
- Global radiation >
- Iller - Lech - Bodensee >
- Trauchgau >
- Chart of total period

Chart of total period Trauchgau
Global radiation from 11.11.2010 to 24.04.2024
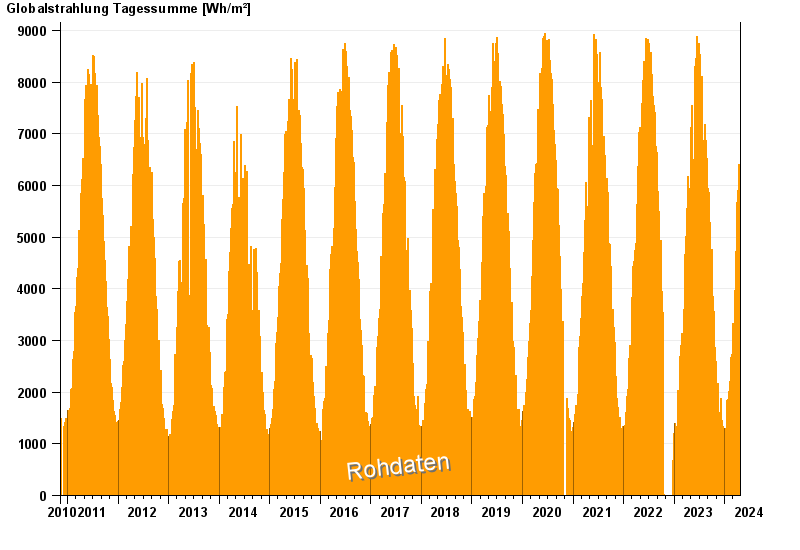
Note: The time series in the selected period has gaps.
| Date | Global radiation [Wh/m²] |
|---|---|
| 24.04.2024 | 4370.5 |
| 23.04.2024 | 1665.5 |
| 22.04.2024 | 1023.8 |
| 21.04.2024 | 2435.8 |
| 20.04.2024 | 1849.5 |
| 19.04.2024 | 2729.8 |
| 18.04.2024 | 4218.7 |
© Bayerisches Landesamt für Umwelt 2024