
- Start >
- Meteorology >
- Global radiation >
- Bayern >
- Gerbrunn >
- Chart of total period

Chart of total period Gerbrunn
Global radiation from 17.08.1994 to 16.04.2024
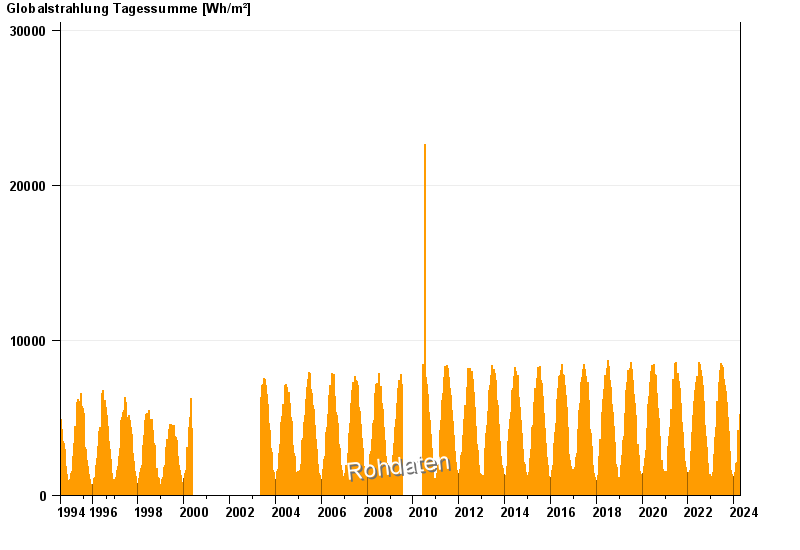
Note: The time series in the selected period has gaps.
| Date | Global radiation [Wh/m²] |
|---|---|
| 16.04.2024 | 114.2 |
| 15.04.2024 | 4203.6 |
| 14.04.2024 | 5065.6 |
| 13.04.2024 | 5558.6 |
| 12.04.2024 | 5981.1 |
| 11.04.2024 | 5940.2 |
| 10.04.2024 | 4146.0 |
© Bayerisches Landesamt für Umwelt 2024