
- Start >
- Meteorology >
- Global radiation >
- Bayern >
- Ettleben >
- Chart of year

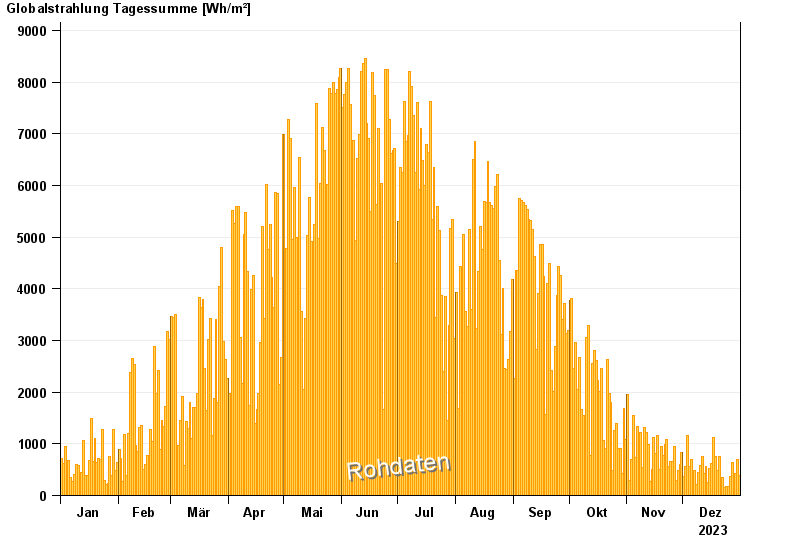
Chart of year Ettleben
Global radiation from 01.01.2023 to 31.12.2023
| Date | Global radiation [Wh/m²] |
|---|---|
| 31.12.2023 | 390.0 |
| 30.12.2023 | 696.5 |
| 29.12.2023 | 433.5 |
| 28.12.2023 | 424.5 |
| 27.12.2023 | 636.6 |
| 26.12.2023 | 360.9 |
| 25.12.2023 | 176.9 |
© Bayerisches Landesamt für Umwelt 2025