
- Start >
- Meteorology >
- Global radiation >
- Bayern >
- Bischbrunn >
- Chart of total period

Chart of total period Bischbrunn
Global radiation from 10.08.2012 to 25.04.2024
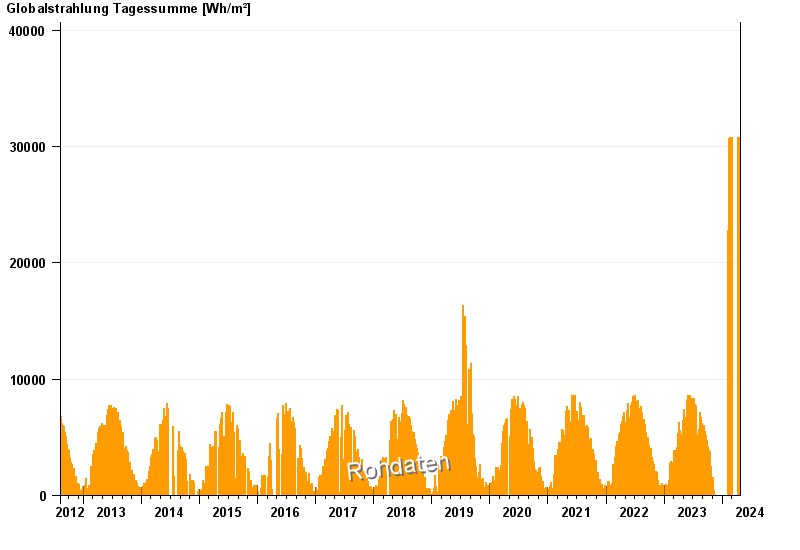
Note: The time series in the selected period has gaps.
| Date | Global radiation [Wh/m²] |
|---|---|
| 25.04.2024 | 20331.7 |
| 24.04.2024 | 30791.7 |
| 23.04.2024 | 30821.7 |
| 22.04.2024 | 30810.0 |
| 21.04.2024 | 30723.3 |
| 20.04.2024 | 30801.7 |
| 19.04.2024 | 30720.0 |
© Bayerisches Landesamt für Umwelt 2024