
- Start >
- Meteorology >
- Air temperature >
- Unterer Main >
- Fladungen-Leubach >
- Chart of year

Chart of year Fladungen-Leubach
Air temperatur from 18.01.2022 to 17.01.2023
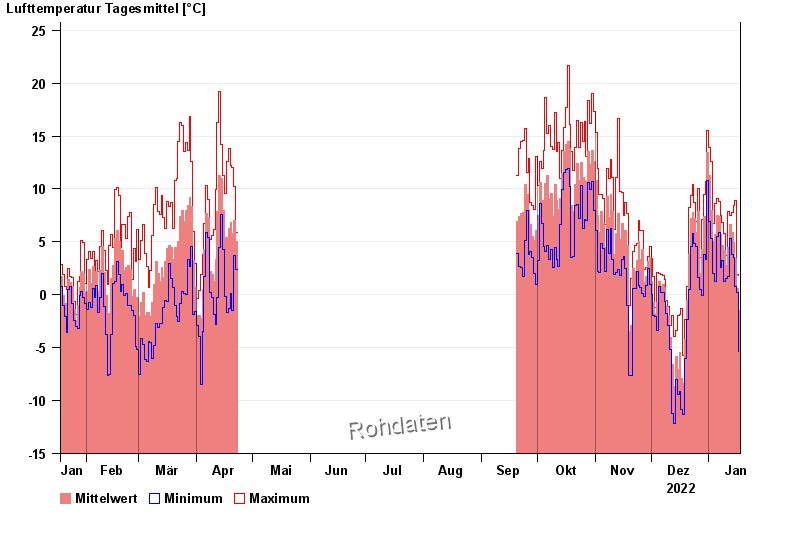
Note: The time series in the selected period has gaps.
| Date | Mean value [°C] | Maximum [°C] | Minimum [°C] |
|---|---|---|---|
| 17.01.2023 | -1.5 | 1.8 | -5.4 |
| 16.01.2023 | 0.6 | 1.9 | 0.2 |
| 15.01.2023 | 3.4 | 8.9 | 0.8 |
| 14.01.2023 | 4.9 | 8.4 | 3.5 |
| 13.01.2023 | 5.9 | 7.8 | 3.8 |
| 12.01.2023 | 6.6 | 7.5 | 5.3 |
| 11.01.2023 | 4.5 | 7.9 | 1.7 |
© Bayerisches Landesamt für Umwelt 2024