
- Start >
- Meteorology >
- Air pressure >
- Iller - Lech - Bodensee >
- Trauchgau >
- Chart of total period

Chart of total period Trauchgau
Air pressure from 11.11.2010 to 23.04.2024
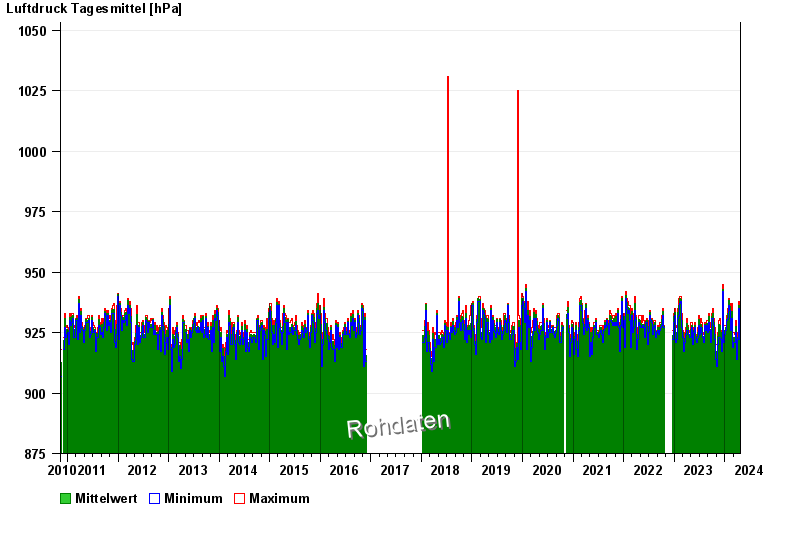
Note: The time series in the selected period has gaps.
| Date | Mean value [hPa] | Maximum [hPa] | Minimum [hPa] |
|---|---|---|---|
| 23.04.2024 | 918.5 | 920.0 | 918.0 |
| 22.04.2024 | 921.0 | 922.0 | 920.0 |
| 21.04.2024 | 921.3 | 924.0 | 920.0 |
| 20.04.2024 | 921.0 | 924.0 | 916.0 |
| 19.04.2024 | 919.3 | 924.0 | 915.0 |
| 18.04.2024 | 919.4 | 924.0 | 915.0 |
| 17.04.2024 | 914.3 | 916.0 | 913.0 |
© Bayerisches Landesamt für Umwelt 2024