
- Start >
- Meteorology >
- Air pressure >
- Oberer Main - Elbe >
- Rödental-Schönstädt (Speicher) >
- Chart of total period

Chart of total period Rödental-Schönstädt (Speicher)
Air pressure from 26.06.2015 to 19.04.2024
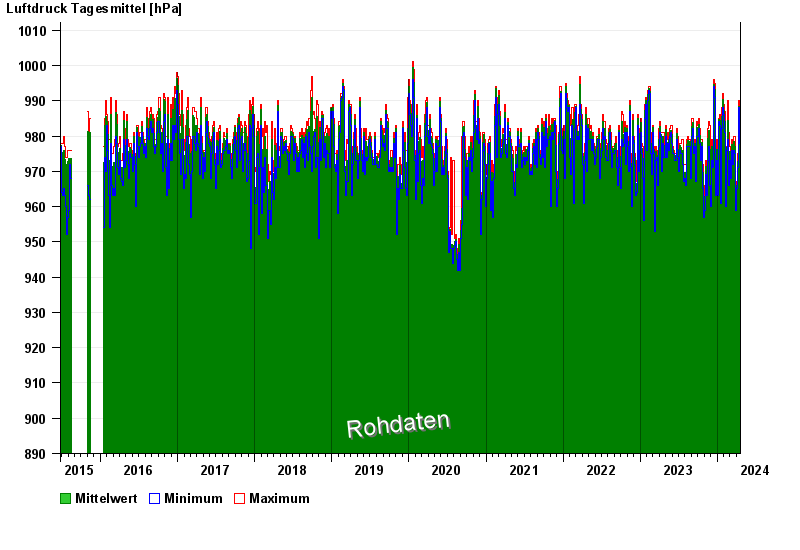
Note: The time series in the selected period has gaps.
| Date | Mean value [hPa] | Maximum [hPa] | Minimum [hPa] |
|---|---|---|---|
| 19.04.2024 | 967.5 | 973.0 | 962.0 |
| 18.04.2024 | 970.6 | 973.0 | 967.0 |
| 17.04.2024 | 964.1 | 967.0 | 962.0 |
| 16.04.2024 | 960.0 | 962.0 | 957.0 |
| 15.04.2024 | 964.6 | 971.0 | 957.0 |
| 14.04.2024 | 975.5 | 978.0 | 971.0 |
| 13.04.2024 | 982.5 | 986.0 | 978.0 |
© Bayerisches Landesamt für Umwelt 2024