
- Start >
- Meteorology >
- Air moisture >
- Regnitz >
- Wadenbrunn >
- Chart of total period

Chart of total period Wadenbrunn
Air moisture from 13.08.1994 to 18.04.2024
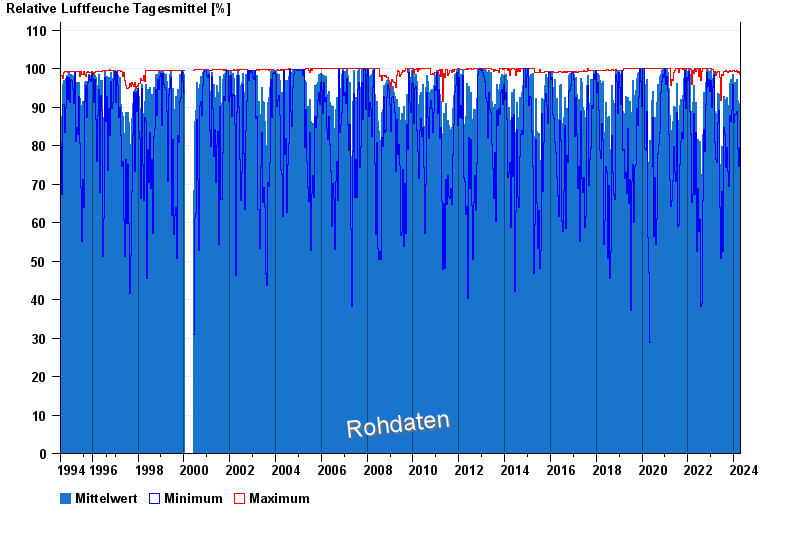
Note: The time series in the selected period has gaps.
| Date | Mean value [%] | Maximum [%] | Minimum [%] |
|---|---|---|---|
| 18.04.2024 | 78.6 | 95.8 | 50.4 |
| 17.04.2024 | 75.4 | 96.3 | 42.8 |
| 16.04.2024 | 83.4 | 92.3 | 69.6 |
| 15.04.2024 | 65.0 | 85.9 | 31.7 |
| 14.04.2024 | 62.7 | 85.8 | 33.9 |
| 13.04.2024 | 71.2 | 97.1 | 45.1 |
| 12.04.2024 | 63.9 | 89.8 | 36.1 |
© Bayerisches Landesamt für Umwelt 2024