
- Start >
- Meteorology >
- Air moisture >
- Untere Donau >
- Triesdorf >
- Chart of total period

Chart of total period Triesdorf
Air moisture from 01.08.1994 to 23.04.2024
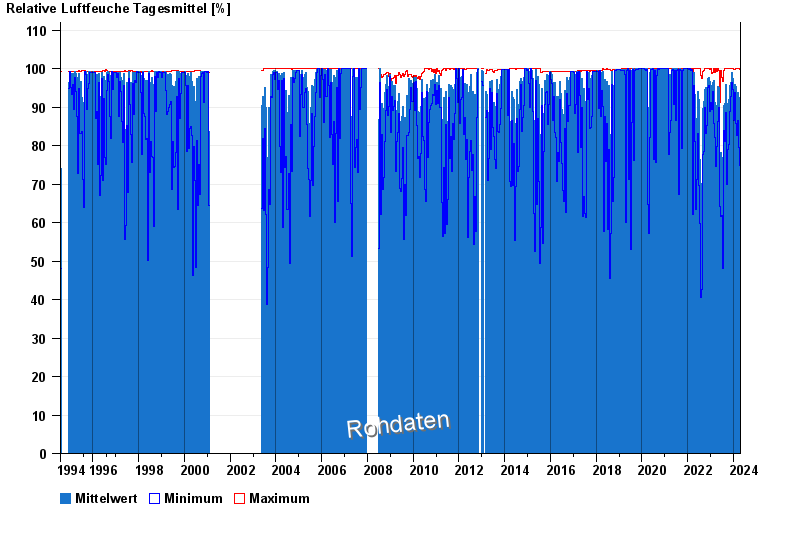
Note: The time series in the selected period has gaps.
| Date | Mean value [%] | Maximum [%] | Minimum [%] |
|---|---|---|---|
| 23.04.2024 | 77.9 | 84.1 | 65.1 |
| 22.04.2024 | 72.6 | 93.3 | 50.8 |
| 21.04.2024 | 92.0 | 97.3 | 80.4 |
| 20.04.2024 | 79.4 | 93.2 | 54.2 |
| 19.04.2024 | 91.4 | 97.0 | 82.7 |
| 18.04.2024 | 84.6 | 97.8 | 62.9 |
| 17.04.2024 | 83.2 | 98.2 | 55.9 |
© Bayerisches Landesamt für Umwelt 2024