
- Start >
- Meteorology >
- Air moisture >
- Untere Donau >
- Pösing >
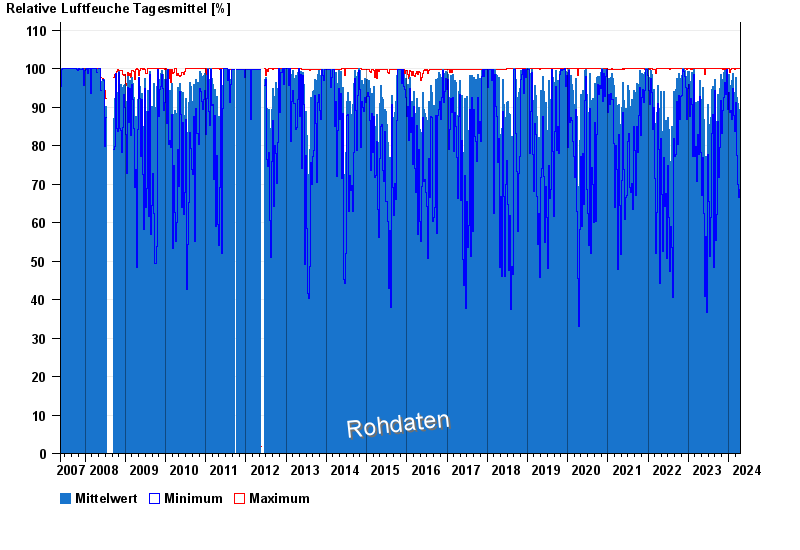
- Chart of total period

Chart of total period Pösing
Air moisture from 22.05.2007 to 19.04.2024
Note: The time series in the selected period has gaps.
| Date | Mean value [%] | Maximum [%] | Minimum [%] |
|---|---|---|---|
| 19.04.2024 | 92.7 | 99.9 | 73.2 |
| 18.04.2024 | 92.8 | 99.9 | 72.1 |
| 17.04.2024 | 92.7 | 99.9 | 62.4 |
| 16.04.2024 | 84.0 | 98.5 | 70.6 |
| 15.04.2024 | 87.8 | 100.0 | 68.6 |
| 14.04.2024 | 77.7 | 100.0 | 49.9 |
| 13.04.2024 | 77.6 | 100.0 | 52.1 |
© Bayerisches Landesamt für Umwelt 2024