
- Start >
- Meteorology >
- Air moisture >
- Untere Donau >
- Piering >
- Chart of total period

Chart of total period Piering
Air moisture from 16.04.1994 to 25.04.2024
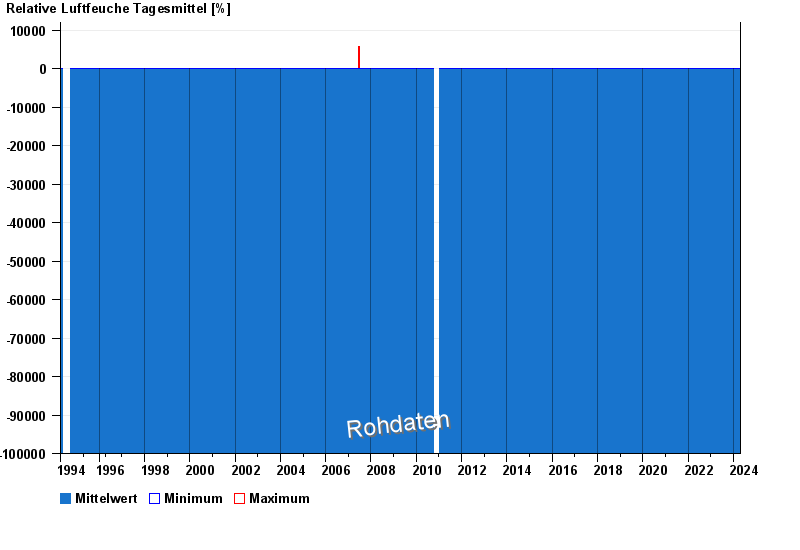
Note: The time series in the selected period has gaps.
| Date | Mean value [%] | Maximum [%] | Minimum [%] |
|---|---|---|---|
| 25.04.2024 | 76.9 | 94.1 | 54.4 |
| 24.04.2024 | 75.0 | 92.1 | 50.5 |
| 23.04.2024 | 76.0 | 83.4 | 66.7 |
| 22.04.2024 | 68.3 | 86.9 | 47.1 |
| 21.04.2024 | 89.9 | 96.2 | 79.0 |
| 20.04.2024 | 86.3 | 94.3 | 77.7 |
| 19.04.2024 | 85.2 | 91.8 | 67.6 |
© Bayerisches Landesamt für Umwelt 2024