
- Start >
- Meteorology >
- Air moisture >
- Naab - Regen >
- See >
- Chart of total period

Chart of total period See
Air moisture from 24.04.2008 to 24.04.2024
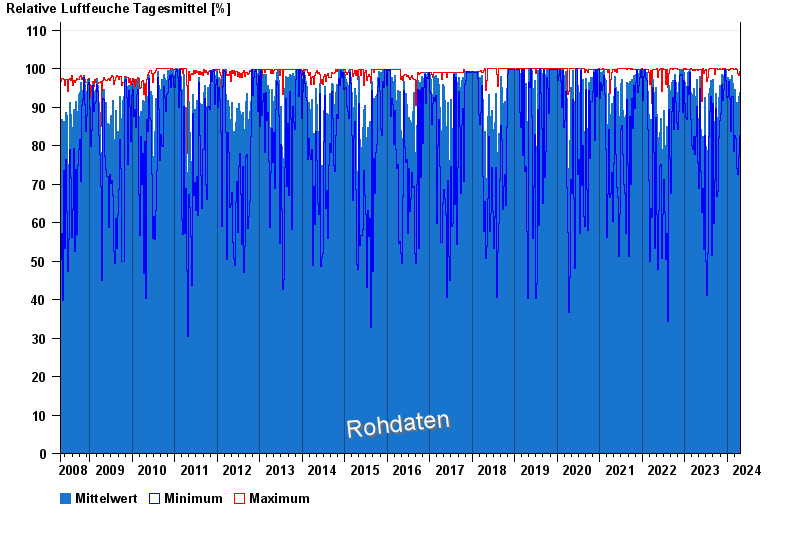
Note: The time series in the selected period has gaps.
| Date | Mean value [%] | Maximum [%] | Minimum [%] |
|---|---|---|---|
| 24.04.2024 | 80.8 | 90.0 | 62.2 |
| 23.04.2024 | 69.2 | 82.3 | 54.2 |
| 22.04.2024 | 70.9 | 92.3 | 51.0 |
| 21.04.2024 | 94.8 | 98.8 | 87.5 |
| 20.04.2024 | 91.6 | 97.2 | 78.1 |
| 19.04.2024 | 93.9 | 98.2 | 82.6 |
| 18.04.2024 | 87.1 | 98.3 | 60.4 |
© Bayerisches Landesamt für Umwelt 2024