
- Start >
- Meteorology >
- Air moisture >
- Naab - Regen >
- Allmannsdorf >
- Chart of total period

Chart of total period Allmannsdorf
Air moisture from 15.10.2004 to 20.04.2024
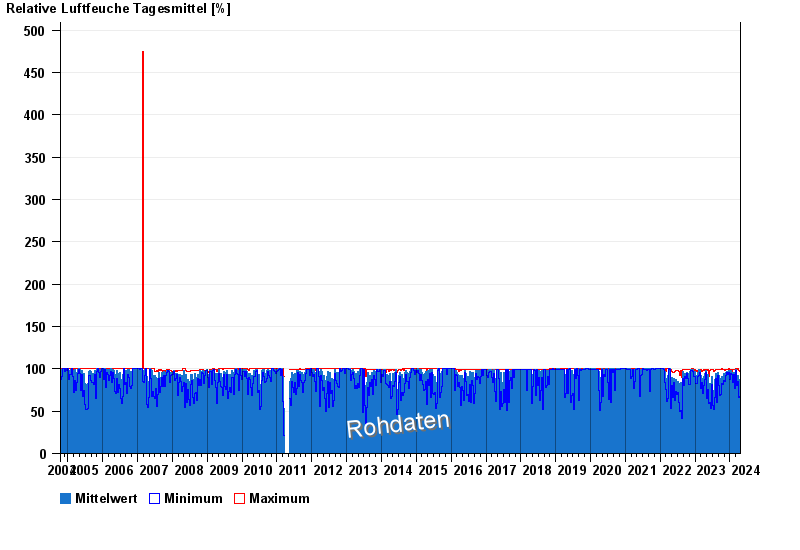
Note: The time series in the selected period has gaps.
| Date | Mean value [%] | Maximum [%] | Minimum [%] |
|---|---|---|---|
| 20.04.2024 | 91.9 | 96.9 | 81.9 |
| 19.04.2024 | 92.3 | 98.8 | 77.1 |
| 18.04.2024 | 94.4 | 98.9 | 80.6 |
| 17.04.2024 | 92.3 | 97.8 | 66.9 |
| 16.04.2024 | 83.0 | 97.3 | 65.3 |
| 15.04.2024 | 81.9 | 94.5 | 67.0 |
| 14.04.2024 | 60.2 | 70.5 | 46.9 |
© Bayerisches Landesamt für Umwelt 2024