
- Start >
- Meteorology >
- Air moisture >
- Unterer Main >
- Wadenbrunn >
- Chart of total period

Chart of total period Wadenbrunn
Air moisture from 13.08.1994 to 24.04.2024
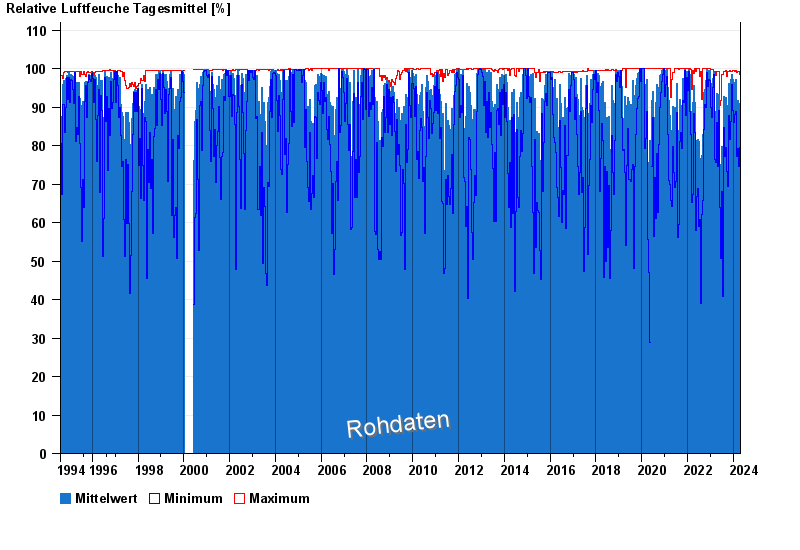
Note: The time series in the selected period has gaps.
| Date | Mean value [%] | Maximum [%] | Minimum [%] |
|---|---|---|---|
| 24.04.2024 | 58.2 | 58.2 | 58.2 |
| 23.04.2024 | 57.2 | 82.3 | 31.7 |
| 22.04.2024 | 73.8 | 89.6 | 55.3 |
| 21.04.2024 | 91.1 | 98.3 | 77.7 |
| 20.04.2024 | 72.4 | 90.7 | 48.7 |
| 19.04.2024 | 87.9 | 93.1 | 76.9 |
| 18.04.2024 | 78.0 | 95.8 | 50.4 |
© Bayerisches Landesamt für Umwelt 2024