
- Start >
- Meteorology >
- Air moisture >
- Unterer Main >
- Schöllkrippen >
- Chart of total period

Chart of total period Schöllkrippen
Air moisture from 23.07.2010 to 24.04.2024
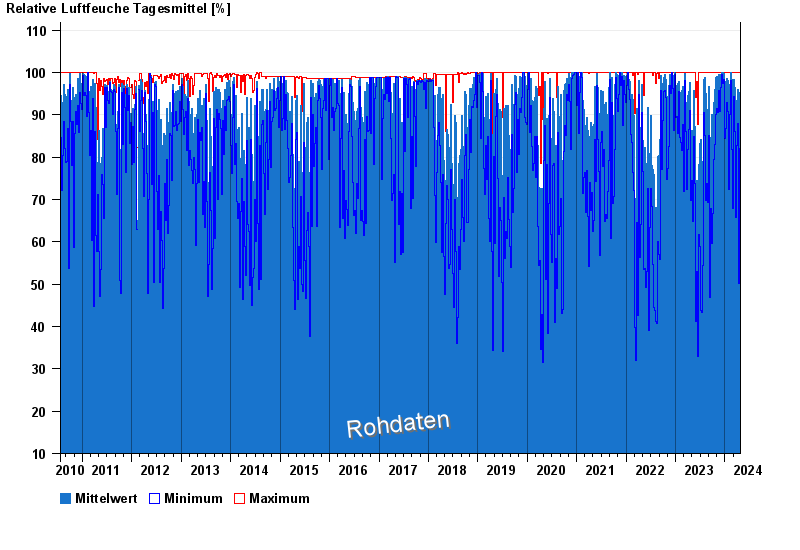
Note: The time series in the selected period has gaps.
| Date | Mean value [%] | Maximum [%] | Minimum [%] |
|---|---|---|---|
| 24.04.2024 | 91.1 | 94.4 | 87.1 |
| 23.04.2024 | 60.6 | 94.3 | 32.4 |
| 22.04.2024 | 79.1 | 98.5 | 53.0 |
| 21.04.2024 | 89.2 | 100.0 | 68.3 |
| 20.04.2024 | 83.4 | 100.0 | 57.3 |
| 19.04.2024 | 95.2 | 100.0 | 82.0 |
| 18.04.2024 | 80.4 | 100.0 | 44.4 |
© Bayerisches Landesamt für Umwelt 2024