
- Start >
- Meteorology >
- Air moisture >
- Unterer Main >
- Hammelburg-Seeshof >
- Chart of year

Chart of year Hammelburg-Seeshof
Air moisture from 18.10.2020 to 17.10.2021
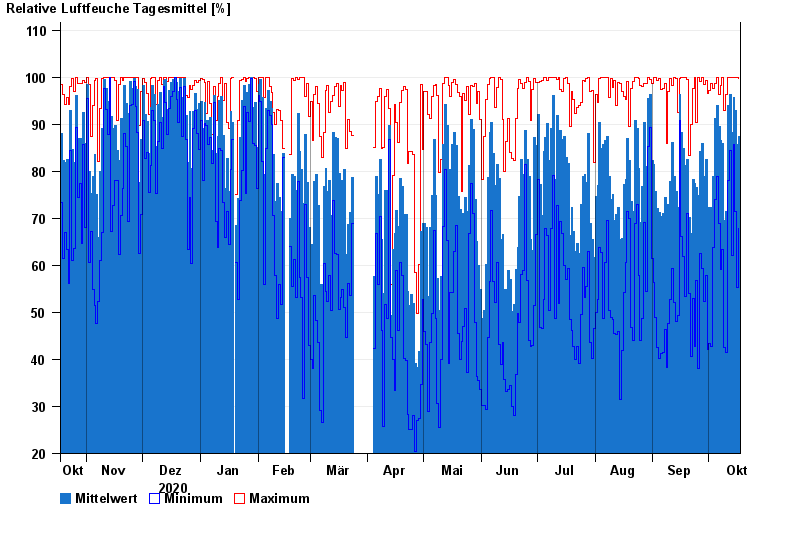
Note: The time series in the selected period has gaps.
| Date | Mean value [%] | Maximum [%] | Minimum [%] |
|---|---|---|---|
| 17.10.2021 | 87.5 | 99.8 | 67.8 |
| 16.10.2021 | 85.7 | 99.9 | 55.3 |
| 15.10.2021 | 93.0 | 99.9 | 71.4 |
| 14.10.2021 | 95.7 | 99.9 | 85.8 |
| 13.10.2021 | 88.2 | 99.9 | 62.0 |
| 12.10.2021 | 96.3 | 99.9 | 84.4 |
| 11.10.2021 | 93.9 | 99.9 | 78.0 |
© Bayerisches Landesamt für Umwelt 2024