
- Start >
- Meteorology >
- Air moisture >
- Unterer Main >
- Hammelburg-Seeshof >
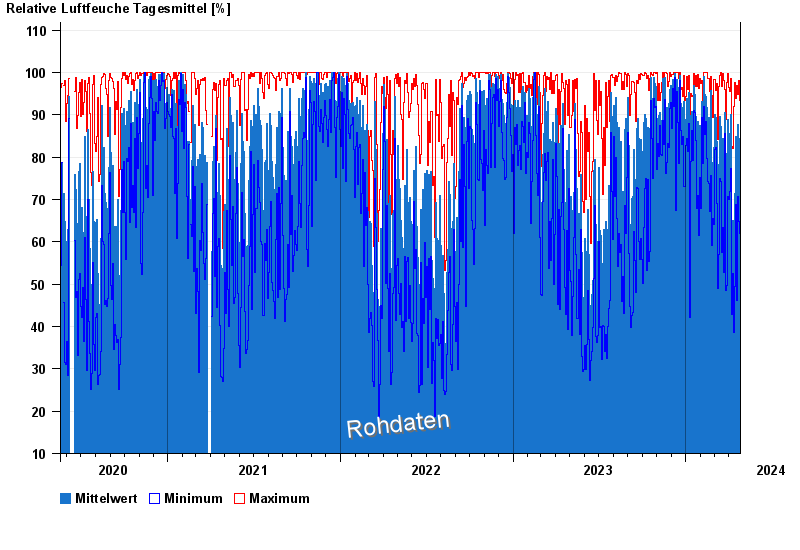
- Chart of total period

Chart of total period Hammelburg-Seeshof
Air moisture from 19.05.2020 to 25.04.2024
Note: The time series in the selected period has gaps.
| Date | Mean value [%] | Maximum [%] | Minimum [%] |
|---|---|---|---|
| 25.04.2024 | 86.3 | 97.2 | 59.3 |
| 24.04.2024 | 79.4 | 93.3 | 61.9 |
| 23.04.2024 | 56.7 | 82.0 | 35.2 |
| 22.04.2024 | 75.4 | 92.4 | 59.6 |
| 21.04.2024 | 84.4 | 98.0 | 64.9 |
| 20.04.2024 | 75.0 | 93.6 | 51.0 |
| 19.04.2024 | 87.7 | 94.8 | 70.6 |
© Bayerisches Landesamt für Umwelt 2024