
- Start >
- Meteorology >
- Air moisture >
- Unterer Main >
- Burgheim >
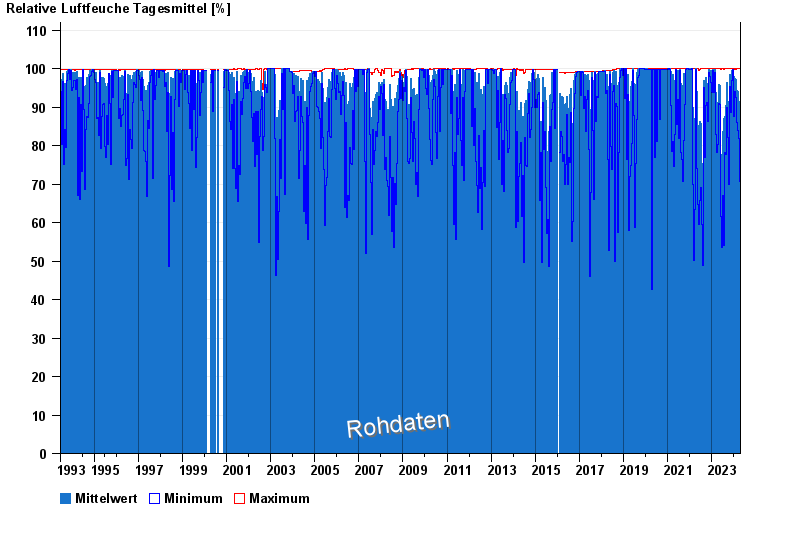
- Chart of total period

Chart of total period Burgheim
Air moisture from 25.06.1993 to 19.04.2024
Note: The time series in the selected period has gaps.
| Date | Mean value [%] | Maximum [%] | Minimum [%] |
|---|---|---|---|
| 19.04.2024 | 90.2 | 96.5 | 76.0 |
| 18.04.2024 | 82.8 | 96.2 | 58.7 |
| 17.04.2024 | 87.6 | 95.8 | 74.0 |
| 16.04.2024 | 74.8 | 92.8 | 54.1 |
| 15.04.2024 | 83.4 | 99.9 | 64.4 |
| 14.04.2024 | 75.6 | 100.0 | 43.9 |
| 13.04.2024 | 75.2 | 99.9 | 42.9 |
© Bayerisches Landesamt für Umwelt 2024