
- Start >
- Meteorology >
- Air moisture >
- Unterer Main >
- Bischbrunn >
- Chart of year

Chart of year Bischbrunn
Air moisture from 26.02.2021 to 25.02.2022
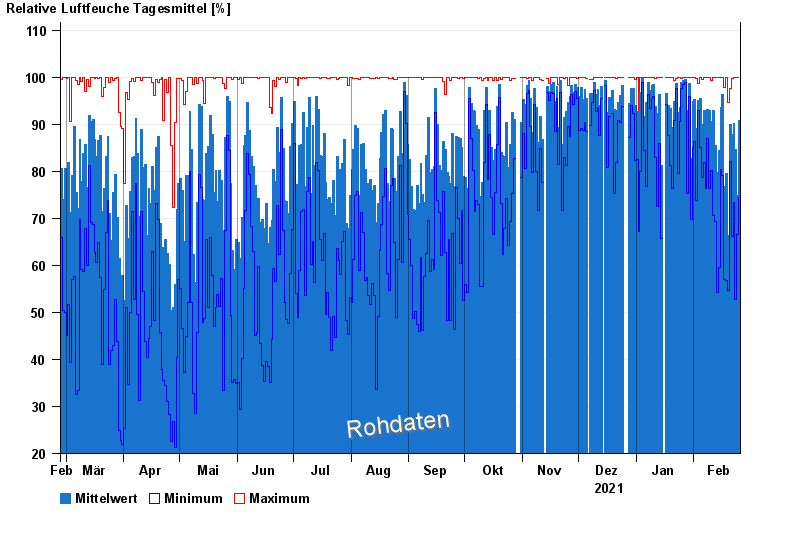
Note: The time series in the selected period has gaps.
| Date | Mean value [%] | Maximum [%] | Minimum [%] |
|---|---|---|---|
| 25.02.2022 | 90.7 | 100.0 | 74.5 |
| 24.02.2022 | 74.9 | 99.9 | 66.6 |
| 23.02.2022 | 84.7 | 100.0 | 52.7 |
| 22.02.2022 | 90.2 | 100.0 | 73.4 |
| 21.02.2022 | 87.9 | 99.7 | 66.2 |
| 20.02.2022 | 89.9 | 97.5 | 82.0 |
| 19.02.2022 | 66.4 | 94.6 | 54.6 |
© Bayerisches Landesamt für Umwelt 2024