
- Start >
- Meteorology >
- Air moisture >
- Obere Donau >
- Puch >
- Chart of year

Chart of year Puch
Air moisture from 01.01.2019 to 31.12.2019
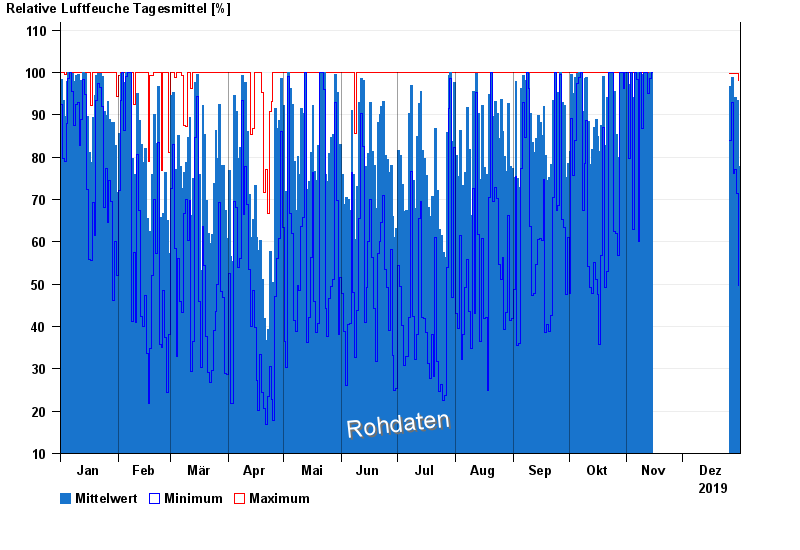
Note: The time series in the selected period has gaps.
| Date | Mean value [%] | Maximum [%] | Minimum [%] |
|---|---|---|---|
| 31.12.2019 | 77.7 | 98.0 | 49.7 |
| 30.12.2019 | 93.5 | 99.8 | 71.5 |
| 29.12.2019 | 94.1 | 99.8 | 77.2 |
| 28.12.2019 | 92.8 | 99.8 | 76.2 |
| 27.12.2019 | 98.9 | 99.8 | 92.9 |
| 26.12.2019 | 96.7 | 99.8 | 84.0 |
| 14.11.2019 | 99.9 | 99.9 | 99.9 |
© Bayerisches Landesamt für Umwelt 2024