
- Start >
- Meteorology >
- Air moisture >
- Isar >
- Schneibsteinhaus >
- Chart of total period

Chart of total period Schneibsteinhaus
Air moisture from 07.04.2022 to 25.04.2024
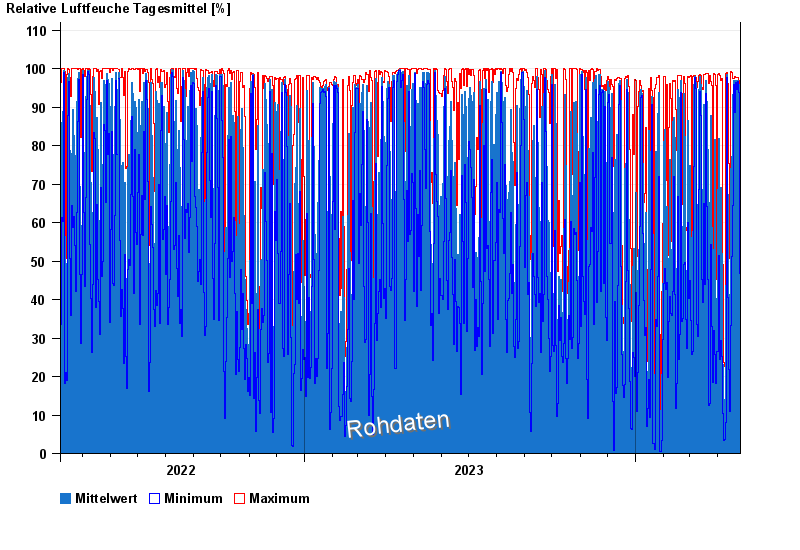
Note: The time series in the selected period has gaps.
| Date | Mean value [%] | Maximum [%] | Minimum [%] |
|---|---|---|---|
| 25.04.2024 | 88.1 | 95.6 | 57.3 |
| 24.04.2024 | 96.0 | 96.8 | 93.9 |
| 23.04.2024 | 97.0 | 97.7 | 96.6 |
| 22.04.2024 | 96.2 | 97.1 | 93.9 |
| 21.04.2024 | 96.4 | 97.8 | 94.6 |
| 20.04.2024 | 96.8 | 97.8 | 96.4 |
| 19.04.2024 | 96.0 | 98.0 | 88.7 |
© Bayerisches Landesamt für Umwelt 2024