
- Start >
- Meteorology >
- Air moisture >
- Isar >
- Nilling >
- Chart of total period

Chart of total period Nilling
Air moisture from 24.07.1994 to 25.04.2024
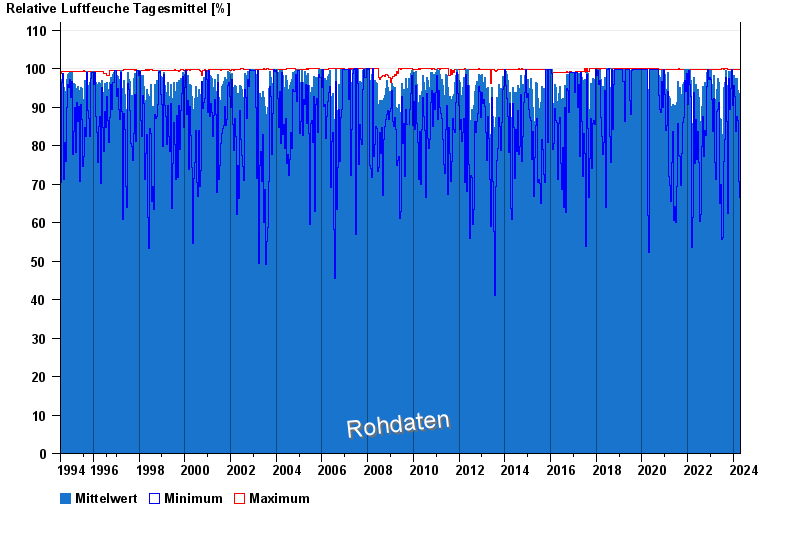
Note: The time series in the selected period has gaps.
| Date | Mean value [%] | Maximum [%] | Minimum [%] |
|---|---|---|---|
| 25.04.2024 | 77.6 | 99.9 | 44.4 |
| 24.04.2024 | 85.9 | 99.2 | 57.9 |
| 23.04.2024 | 79.9 | 96.6 | 71.3 |
| 22.04.2024 | 75.9 | 99.9 | 56.7 |
| 21.04.2024 | 92.3 | 99.9 | 57.5 |
| 20.04.2024 | 85.9 | 98.4 | 65.4 |
| 19.04.2024 | 84.5 | 95.7 | 60.0 |
© Bayerisches Landesamt für Umwelt 2024