
- Start >
- Meteorology >
- Air moisture >
- Isar >
- Hübschenried >
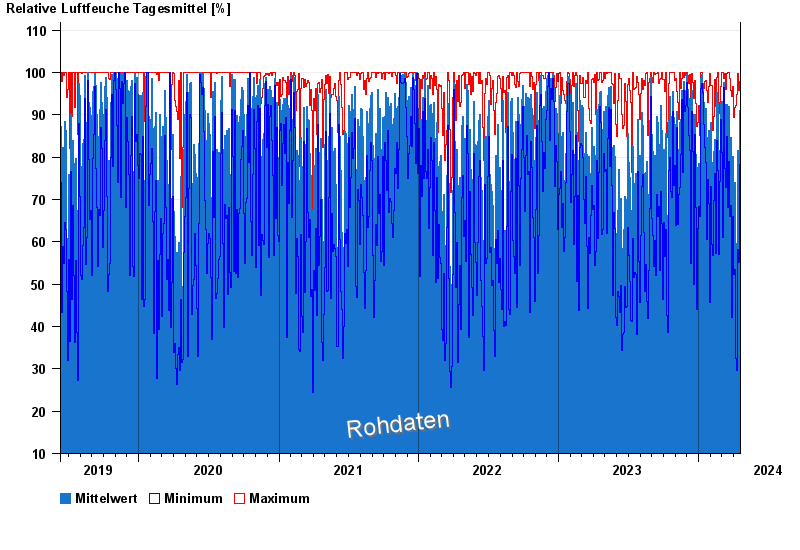
- Chart of total period

Chart of total period Hübschenried
Air moisture from 11.06.2019 to 18.04.2024
| Date | Mean value [%] | Maximum [%] | Minimum [%] |
|---|---|---|---|
| 18.04.2024 | 96.9 | 97.5 | 96.5 |
| 17.04.2024 | 91.0 | 97.8 | 78.2 |
| 16.04.2024 | 72.9 | 96.1 | 50.7 |
| 15.04.2024 | 74.3 | 95.7 | 55.2 |
| 14.04.2024 | 48.5 | 68.1 | 31.7 |
| 13.04.2024 | 65.7 | 93.3 | 41.7 |
| 12.04.2024 | 73.1 | 97.1 | 49.2 |
© Bayerisches Landesamt für Umwelt 2024