
- Start >
- Meteorology >
- Air moisture >
- Isar >
- Fahrenberg >
- Chart of total period

Chart of total period Fahrenberg
Air moisture from 13.09.2019 to 19.04.2024
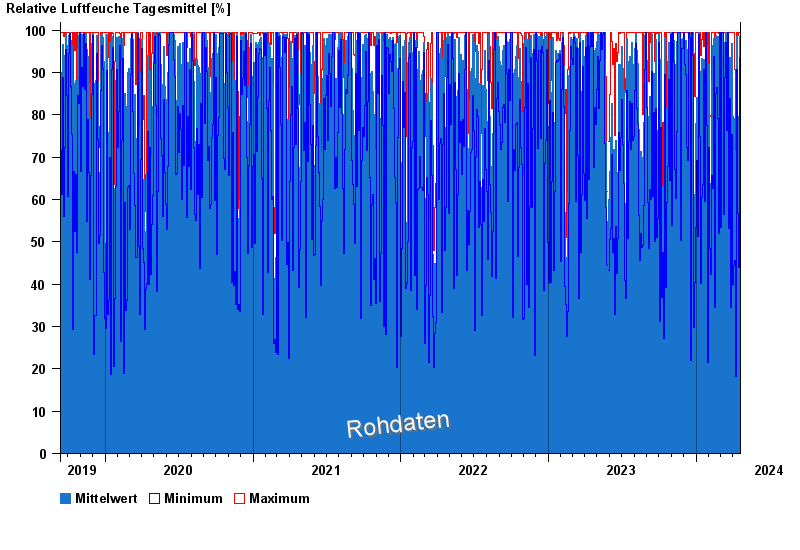
Note: The time series in the selected period has gaps.
| Date | Mean value [%] | Maximum [%] | Minimum [%] |
|---|---|---|---|
| 19.04.2024 | 93.4 | 99.4 | 78.9 |
| 18.04.2024 | 98.3 | 99.4 | 88.5 |
| 17.04.2024 | 98.6 | 99.4 | 93.5 |
| 16.04.2024 | 78.9 | 99.4 | 44.0 |
| 15.04.2024 | 78.2 | 99.5 | 33.4 |
| 14.04.2024 | 31.5 | 47.5 | 18.0 |
| 13.04.2024 | 57.3 | 89.7 | 32.9 |
© Bayerisches Landesamt für Umwelt 2024