
- Start >
- Meteorology >
- Air moisture >
- Inn >
- Otterfing >
- Chart of total period

Chart of total period Otterfing
Air moisture from 14.11.2008 to 19.04.2024
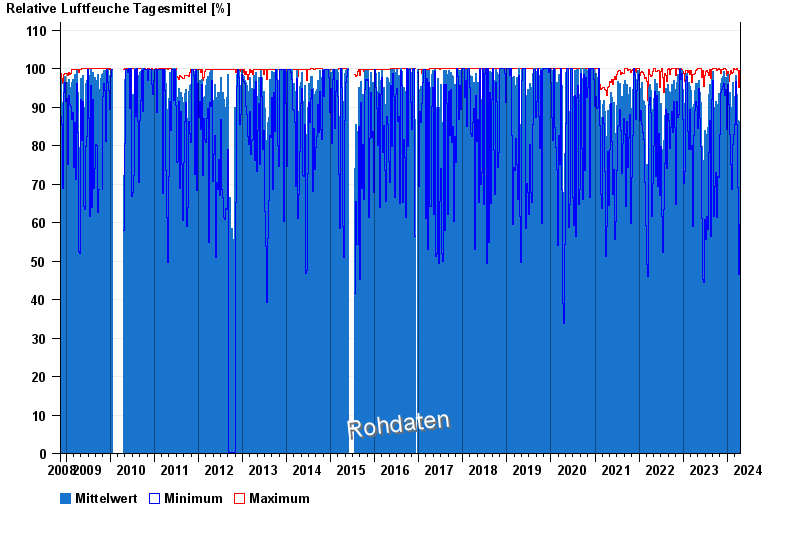
Note: The time series in the selected period has gaps.
| Date | Mean value [%] | Maximum [%] | Minimum [%] |
|---|---|---|---|
| 19.04.2024 | 97.6 | 98.6 | 96.0 |
| 18.04.2024 | 96.1 | 99.0 | 83.7 |
| 17.04.2024 | 91.3 | 98.3 | 81.0 |
| 16.04.2024 | 70.2 | 96.3 | 48.8 |
| 15.04.2024 | 77.0 | 95.1 | 55.7 |
| 14.04.2024 | 48.5 | 73.5 | 27.3 |
| 13.04.2024 | 65.3 | 92.6 | 32.4 |
© Bayerisches Landesamt für Umwelt 2024