
- Start >
- Meteorology >
- Air moisture >
- Inn >
- Aldersbach >
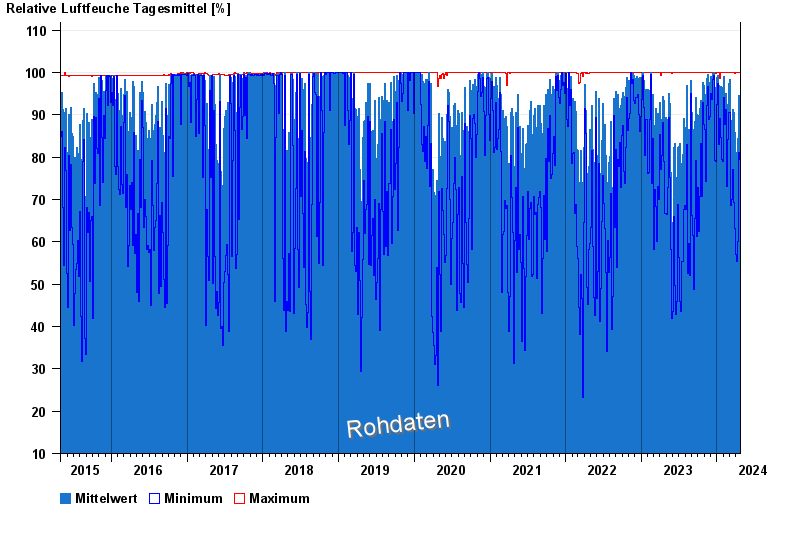
- Chart of total period

Chart of total period Aldersbach
Air moisture from 30.04.2015 to 23.04.2024
Note: The time series in the selected period has gaps.
| Date | Mean value [%] | Maximum [%] | Minimum [%] |
|---|---|---|---|
| 23.04.2024 | 77.2 | 95.9 | 64.7 |
| 22.04.2024 | 68.6 | 99.3 | 46.1 |
| 21.04.2024 | 88.9 | 100.0 | 67.7 |
| 20.04.2024 | 87.9 | 98.7 | 79.3 |
| 19.04.2024 | 88.8 | 99.8 | 71.2 |
| 18.04.2024 | 86.3 | 97.3 | 68.4 |
| 17.04.2024 | 90.0 | 96.3 | 79.5 |
© Bayerisches Landesamt für Umwelt 2024