
- Start >
- Meteorology >
- Air moisture >
- Oberer Main - Elbe >
- Mauthaus (Klimastation) >
- Chart of total period

Chart of total period Mauthaus (Klimastation)
Air moisture from 24.05.2012 to 25.04.2024
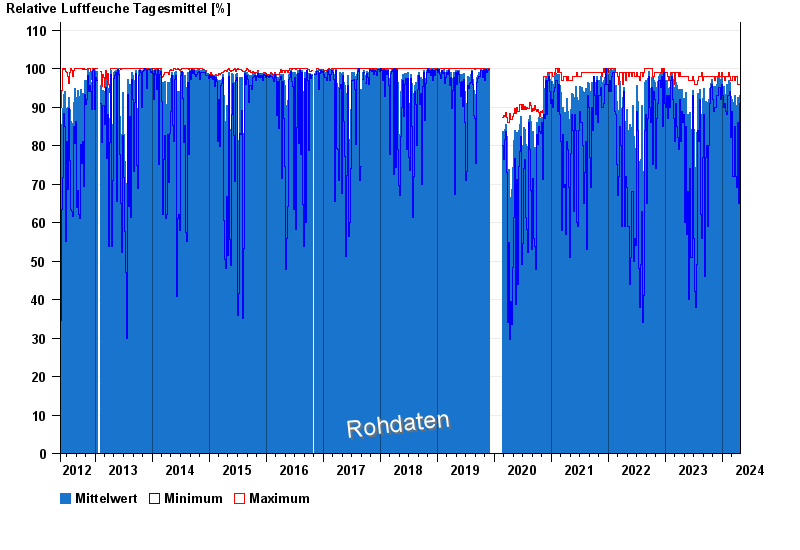
Note: The time series in the selected period has gaps.
| Date | Mean value [%] | Maximum [%] | Minimum [%] |
|---|---|---|---|
| 25.04.2024 | 90.1 | 95.0 | 71.0 |
| 24.04.2024 | 83.3 | 95.0 | 60.0 |
| 23.04.2024 | 67.6 | 94.0 | 35.0 |
| 22.04.2024 | 75.8 | 95.0 | 45.0 |
| 21.04.2024 | 87.3 | 96.0 | 62.0 |
| 20.04.2024 | 89.3 | 94.0 | 74.0 |
| 19.04.2024 | 93.1 | 96.0 | 91.0 |
© Bayerisches Landesamt für Umwelt 2024