
- Start >
- Meteorology >
- Air moisture >
- Oberer Main - Elbe >
- Köslau >
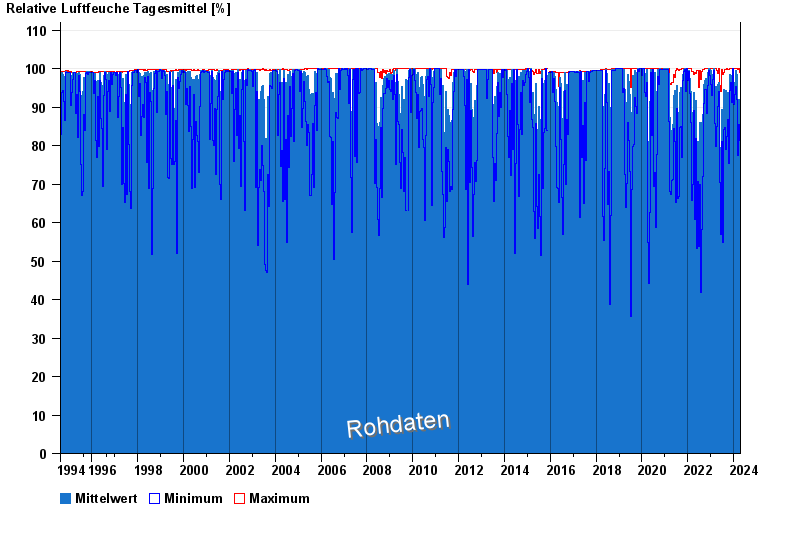
- Chart of total period

Chart of total period Köslau
Air moisture from 19.08.1994 to 18.04.2024
Note: The time series in the selected period has gaps.
| Date | Mean value [%] | Maximum [%] | Minimum [%] |
|---|---|---|---|
| 18.04.2024 | 82.7 | 98.1 | 58.5 |
| 17.04.2024 | 86.1 | 98.7 | 58.8 |
| 16.04.2024 | 88.8 | 97.0 | 74.7 |
| 15.04.2024 | 69.7 | 87.9 | 39.8 |
| 14.04.2024 | 65.6 | 85.5 | 44.6 |
| 13.04.2024 | 74.1 | 97.8 | 53.6 |
| 12.04.2024 | 63.4 | 86.3 | 39.1 |
© Bayerisches Landesamt für Umwelt 2024