
- Start >
- Meteorology >
- Air moisture >
- Bayern >
- Hörmoos 2 >
- Chart of total period

Chart of total period Hörmoos 2
Air moisture from 27.02.2007 to 24.04.2024
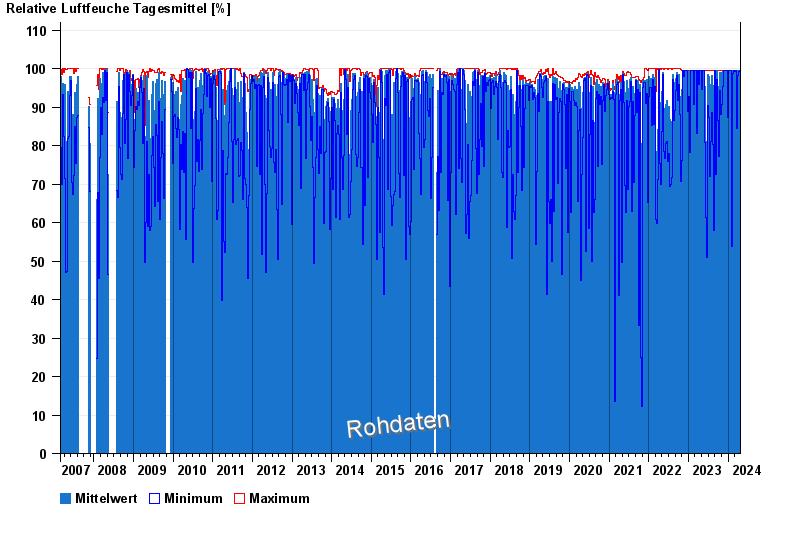
Note: The time series in the selected period has gaps.
| Date | Mean value [%] | Maximum [%] | Minimum [%] |
|---|---|---|---|
| 24.04.2024 | 99.4 | 99.5 | 99.4 |
| 23.04.2024 | 99.4 | 99.5 | 99.4 |
| 22.04.2024 | 99.4 | 99.4 | 99.4 |
| 21.04.2024 | 99.4 | 99.5 | 99.4 |
| 20.04.2024 | 99.4 | 99.5 | 99.4 |
| 19.04.2024 | 99.4 | 99.5 | 99.4 |
| 18.04.2024 | 99.4 | 99.5 | 99.4 |
© Bayerisches Landesamt für Umwelt 2024