
- Start >
- Meteorology >
- Air moisture >
- Bayern >
- Bürgstadt >
- Chart of total period

Chart of total period Bürgstadt
Air moisture from 15.07.1994 to 25.04.2024
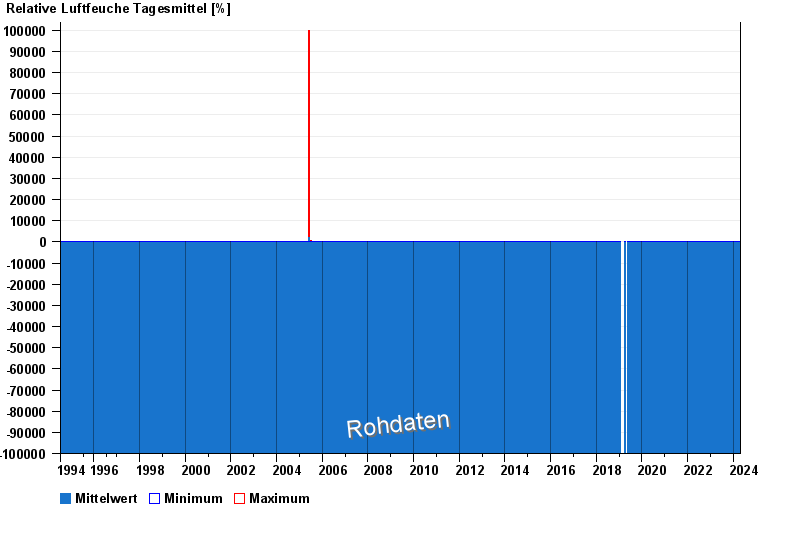
Note: The time series in the selected period has gaps.
| Date | Mean value [%] | Maximum [%] | Minimum [%] |
|---|---|---|---|
| 25.04.2024 | 76.3 | 87.9 | 61.1 |
| 24.04.2024 | 77.8 | 89.5 | 61.6 |
| 23.04.2024 | 66.8 | 96.8 | 34.8 |
| 22.04.2024 | 83.7 | 96.8 | 57.8 |
| 21.04.2024 | 88.9 | 94.9 | 82.5 |
| 20.04.2024 | 75.7 | 93.2 | 55.3 |
| 19.04.2024 | 81.9 | 91.1 | 66.7 |
© Bayerisches Landesamt für Umwelt 2024