
- Start >
- Lakes >
- Waterlevel >
- Isar >
- Kochel Grauer Bär >
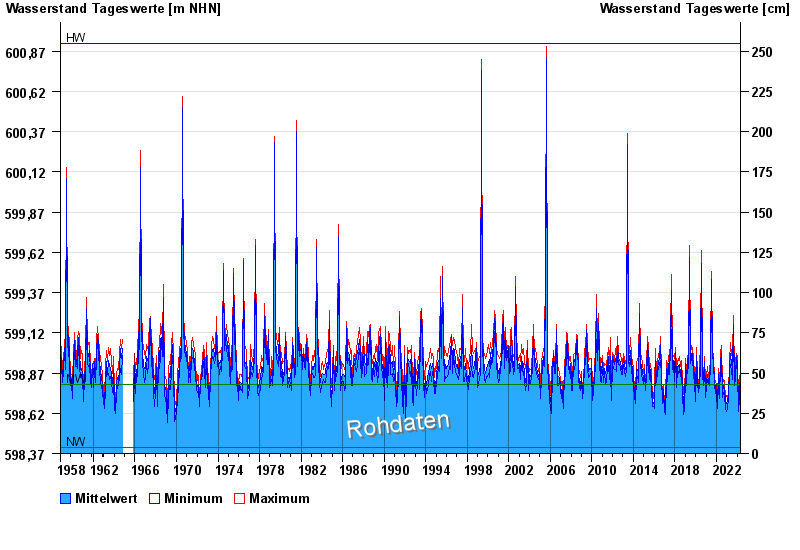
- Chart of total period

Chart of total period Kochel Grauer Bär / Kochelsee
Waterlevel from 01.11.1958 to 25.04.2024
Linien: keine | Hauptwerte | Meldestufen | mittlerer Seespiegel | Hochwassermarken | historische Ereignisse
| Date | Mean value [m above sealevel] | Maximum [m above sealevel] | Minimum [m above sealevel] |
|---|---|---|---|
| 25.04.2024 | 598.82 | 598.83 | 598.82 |
| 24.04.2024 | 598.82 | 598.86 | 598.80 |
| 23.04.2024 | 598.86 | 598.90 | 598.80 |
| 22.04.2024 | 598.71 | 598.81 | 598.65 |
| 21.04.2024 | 598.66 | 598.69 | 598.64 |
| 20.04.2024 | 598.70 | 598.79 | 598.66 |
| 19.04.2024 | 598.75 | 598.81 | 598.73 |
© Bayerisches Landesamt für Umwelt 2024