
- Start >
- Lakes >
- Waterlevel >
- Iller - Lech - Bodensee >
- Schwangau >
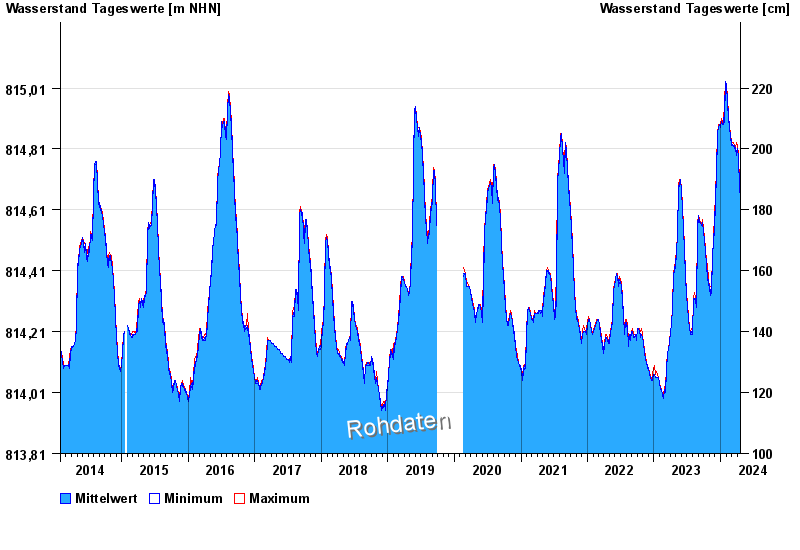
- Chart of total period

Chart of total period Schwangau / Alpsee
Waterlevel from 30.01.2014 to 19.04.2024
Linien: keine | Hauptwerte | Meldestufen | mittlerer Seespiegel | Hochwassermarken | historische Ereignisse
| Date | Mean value [m above sealevel] | Maximum [m above sealevel] | Minimum [m above sealevel] |
|---|---|---|---|
| 19.04.2024 | 814.65 | 814.65 | 814.65 |
| 18.04.2024 | 814.65 | 814.66 | 814.65 |
| 17.04.2024 | 814.65 | 814.65 | 814.64 |
| 16.04.2024 | 814.65 | 814.65 | 814.64 |
| 15.04.2024 | 814.65 | 814.66 | 814.65 |
| 14.04.2024 | 814.66 | 814.67 | 814.66 |
| 13.04.2024 | 814.68 | 814.68 | 814.67 |
© Bayerisches Landesamt für Umwelt 2024