
- Start >
- Lakes >
- Waterlevel >
- Iller - Lech - Bodensee >
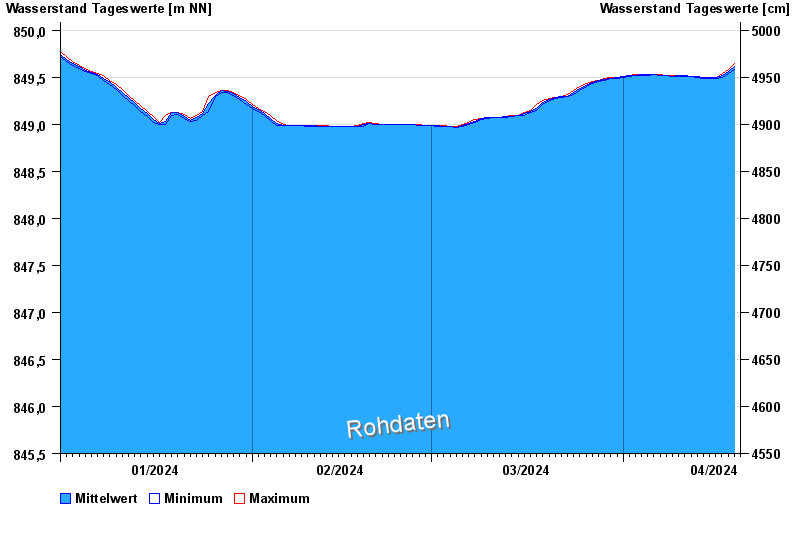
- Rottachsee >
- Chart of year

Chart of year Rottachsee / Rottachsee
Waterlevel from 01.01.2024 to 19.04.2024
Linien: keine | Hauptwerte | Meldestufen | mittlerer Seespiegel | Hochwassermarken | historische Ereignisse
| Date | Mean value [m above sealevel] | Maximum [m above sealevel] | Minimum [m above sealevel] |
|---|---|---|---|
| 19.04.2024 | 849.59 | 849.60 | 849.58 |
| 18.04.2024 | 849.56 | 849.58 | 849.54 |
| 17.04.2024 | 849.52 | 849.54 | 849.50 |
| 16.04.2024 | 849.50 | 849.50 | 849.49 |
| 15.04.2024 | 849.50 | 849.50 | 849.49 |
| 14.04.2024 | 849.50 | 849.50 | 849.49 |
| 13.04.2024 | 849.51 | 849.51 | 849.50 |
© Bayerisches Landesamt für Umwelt 2024