
- Start >
- Lakes >
- Waterlevel >
- Iller - Lech - Bodensee >
- Mühlberg >
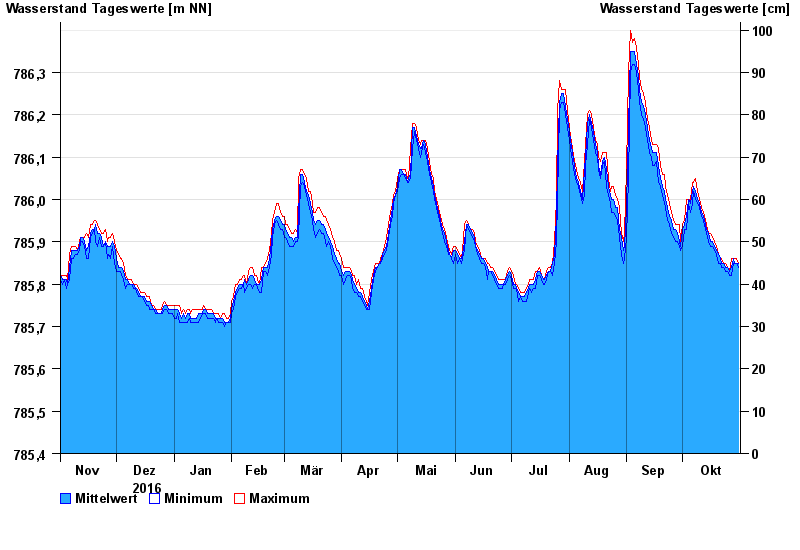
- Chart of year

Chart of year Mühlberg / Bannwaldsee
Waterlevel from 01.11.2016 to 31.10.2017
Linien: keine | Hauptwerte | Meldestufen | mittlerer Seespiegel | Hochwassermarken | historische Ereignisse
| Date | Mean value [m above sealevel] | Maximum [m above sealevel] | Minimum [m above sealevel] |
|---|---|---|---|
| 31.10.2017 | 785.85 | 785.85 | 785.84 |
| 30.10.2017 | 785.85 | 785.86 | 785.85 |
| 29.10.2017 | 785.85 | 785.86 | 785.85 |
| 28.10.2017 | 785.86 | 785.86 | 785.85 |
| 27.10.2017 | 785.84 | 785.86 | 785.82 |
| 26.10.2017 | 785.83 | 785.83 | 785.82 |
| 25.10.2017 | 785.84 | 785.84 | 785.83 |
© Bayerisches Landesamt für Umwelt 2024