
- Start >
- Lakes >
- Chemistry >
- Isar >
- Garatshausen >
- Chart of total period

Chart of total period Garatshausen / Starnberger See
Data from 25.04.2012 to 08.08.2022
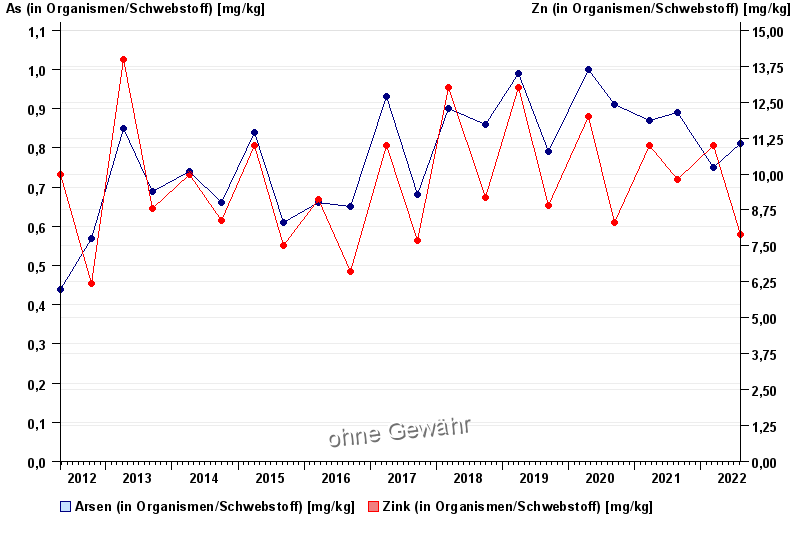
| Date | As (in Organismen/Schwebstoff) [mg/kg] | Zn (in Organismen/Schwebstoff) [mg/kg] |
|---|---|---|
| 08.08.2022 | 0.81 | 7.9 |
| 10.03.2022 | 0.75 | 11 |
| 23.08.2021 | 0.89 | 9.8 |
| 23.03.2021 | 0.87 | 11 |
| 11.09.2020 | 0.91 | 8.3 |
| 20.04.2020 | 1 | 12 |
| 11.09.2019 | 0.79 | 8.9 |
© Bayerisches Landesamt für Umwelt 2024