
- Start >
- Groundwater >
- Chemistry >
- Untere Donau >
- 4110714100005 >
- Chart of total period

Chart of total period 4110714100005
Data from 18.06.2007 to 30.03.2021
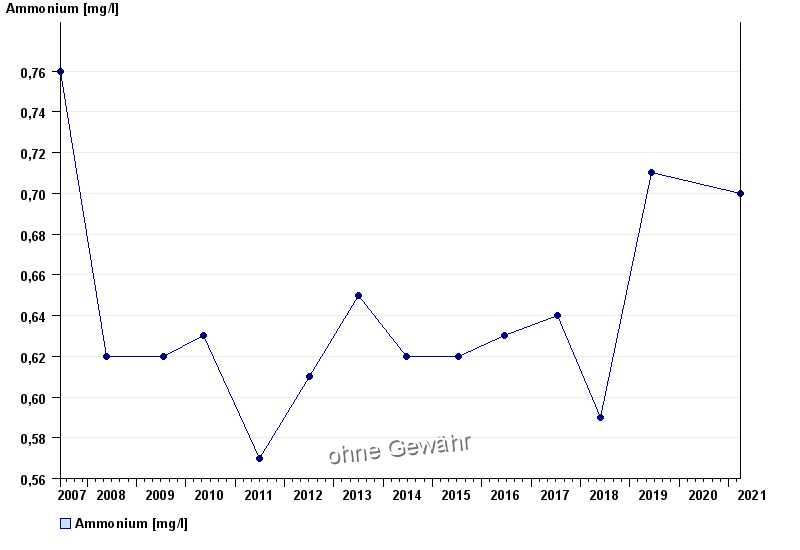
| Date | Ammonium [mg/l] |
|---|---|
| 30.03.2021 | 0.7 |
| 13.06.2019 | 0.71 |
| 28.05.2018 | 0.59 |
| 12.07.2017 | 0.64 |
| 20.06.2016 | 0.63 |
| 13.07.2015 | 0.62 |
| 24.06.2014 | 0.62 |
© Bayerisches Landesamt für Umwelt 2024