
- Start >
- Groundwater >
- Chemistry >
- Untere Donau >
- 4110703600006 >
- Chart of total period

Chart of total period 4110703600006
Data from 15.10.2014 to 29.06.2021
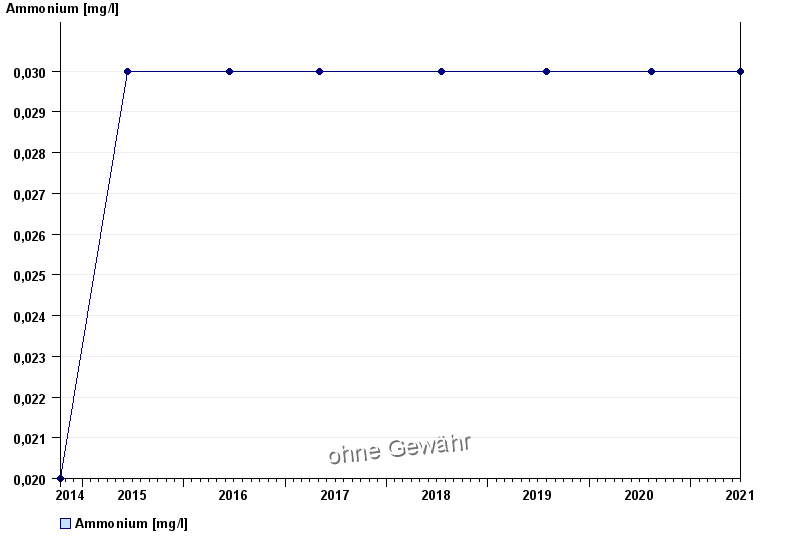
| Date | Ammonium [mg/l] |
|---|---|
| 29.06.2021 | 0.03 |
| 11.08.2020 | < 0.03 |
| 31.07.2019 | < 0.03 |
| 18.07.2018 | < 0.03 |
| 03.05.2017 | < 0.03 |
| 14.06.2016 | < 0.03 |
| 15.06.2015 | < 0.03 |
© Bayerisches Landesamt für Umwelt 2024