
- Start >
- Groundwater >
- Chemistry >
- Untere Donau >
- 1131754000057 >
- Chart of total period

Chart of total period 1131754000057
Data from 16.10.2014 to 08.09.2021
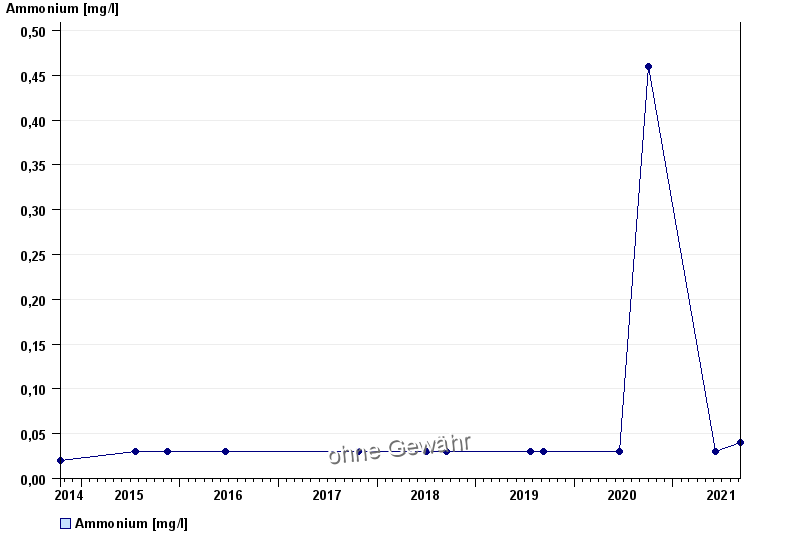
| Date | Ammonium [mg/l] |
|---|---|
| 08.09.2021 | 0.04 |
| 08.06.2021 | < 0.03 |
| 01.10.2020 | 0.46 |
| 18.06.2020 | < 0.03 |
| 09.09.2019 | < 0.03 |
| 23.07.2019 | < 0.03 |
| 13.09.2018 | < 0.03 |
© Bayerisches Landesamt für Umwelt 2024