
- Start >
- Groundwater >
- Chemistry >
- Naab - Regen >
- 1131643800028 >
- Chart of total period

Chart of total period 1131643800028
Data from 11.06.2007 to 20.04.2021
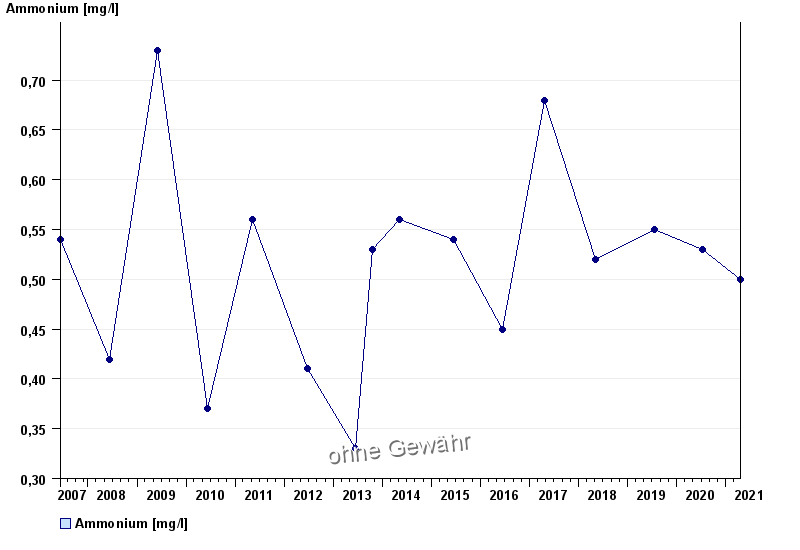
| Date | Ammonium [mg/l] |
|---|---|
| 20.04.2021 | 0.5 |
| 08.07.2020 | 0.53 |
| 17.07.2019 | 0.55 |
| 07.05.2018 | 0.52 |
| 24.04.2017 | 0.68 |
| 16.06.2016 | 0.45 |
| 17.06.2015 | 0.54 |
© Bayerisches Landesamt für Umwelt 2024