
- Start >
- Groundwater >
- Chemistry >
- Unterer Main >
- 1132652700059 >
- Chart of total period

Chart of total period 1132652700059
Data from 07.09.2011 to 05.10.2021
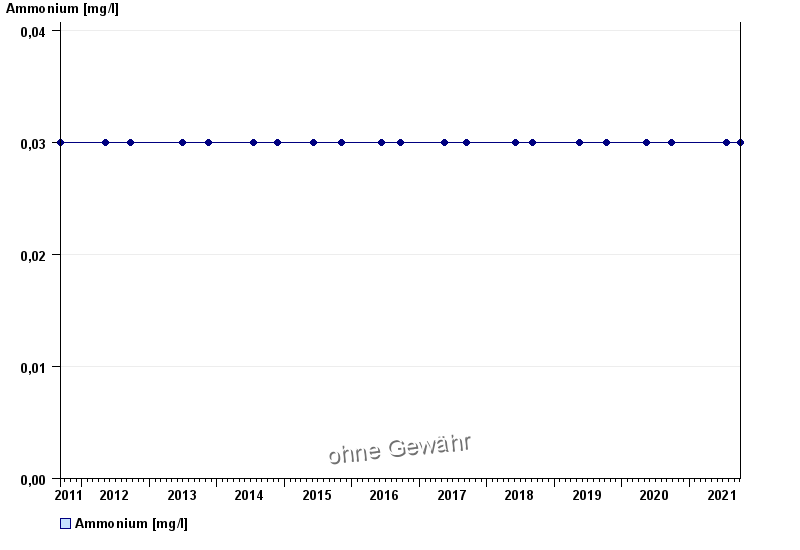
| Date | Ammonium [mg/l] |
|---|---|
| 05.10.2021 | < 0.03 |
| 19.07.2021 | < 0.03 |
| 28.09.2020 | < 0.03 |
| 12.05.2020 | < 0.03 |
| 08.10.2019 | < 0.03 |
| 20.05.2019 | < 0.03 |
| 05.09.2018 | < 0.03 |
© Bayerisches Landesamt für Umwelt 2024