
- Start >
- Groundwater >
- Chemistry >
- Unterer Main >
- 1131602200016 >
- Chart of total period

Chart of total period 1131602200016
Data from 17.07.2007 to 15.11.2021
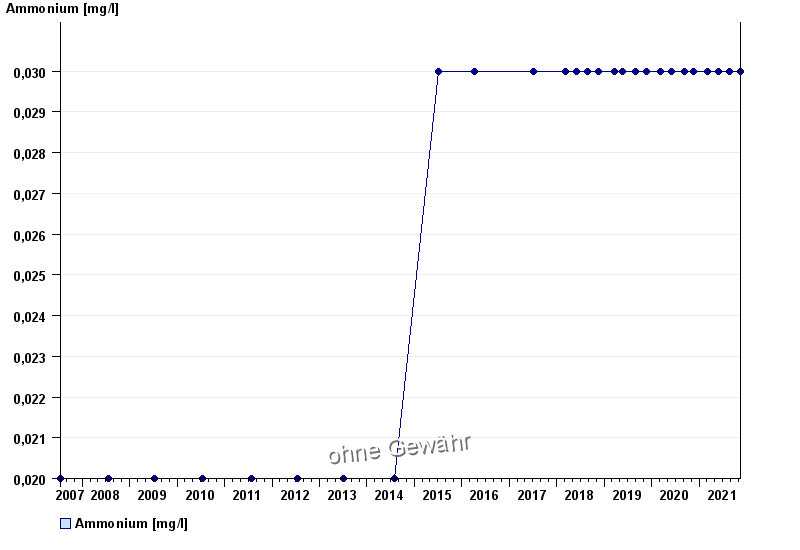
| Date | Ammonium [mg/l] |
|---|---|
| 15.11.2021 | < 0.03 |
| 25.08.2021 | < 0.03 |
| 31.05.2021 | < 0.03 |
| 08.03.2021 | < 0.03 |
| 17.11.2020 | < 0.03 |
| 08.09.2020 | < 0.03 |
| 04.06.2020 | < 0.03 |
© Bayerisches Landesamt für Umwelt 2024