
- Start >
- Groundwater >
- Chemistry >
- Inn >
- 4120823600020 >
- Chart of total period

Chart of total period 4120823600020
Data from 21.05.2007 to 14.07.2021
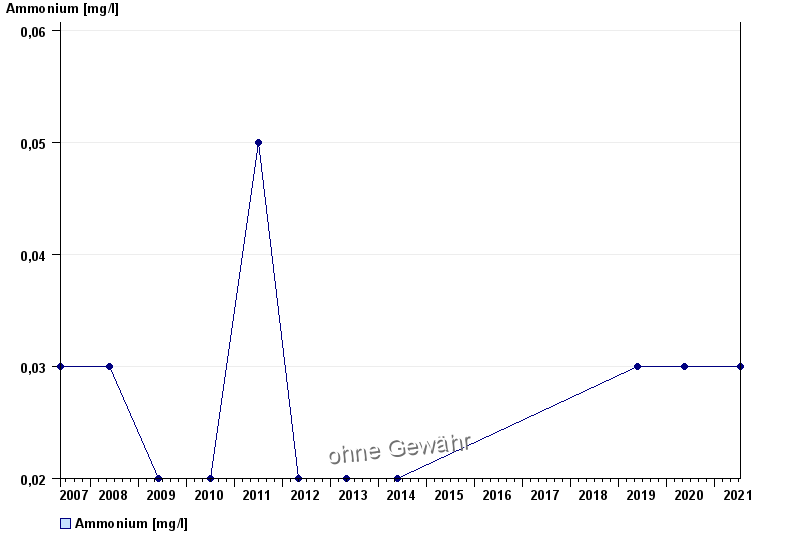
| Date | Ammonium [mg/l] |
|---|---|
| 14.07.2021 | < 0.03 |
| 12.05.2020 | < 0.03 |
| 21.05.2019 | < 0.03 |
| 28.05.2014 | < 0.02 |
| 02.05.2013 | < 0.02 |
| 03.05.2012 | < 0.02 |
| 30.06.2011 | 0.05 |
© Bayerisches Landesamt für Umwelt 2024