
- Start >
- Groundwater >
- Chemistry >
- Inn >
- 4120744500020 >
- Chart of total period

Chart of total period 4120744500020
Data from 11.06.2007 to 10.11.2021
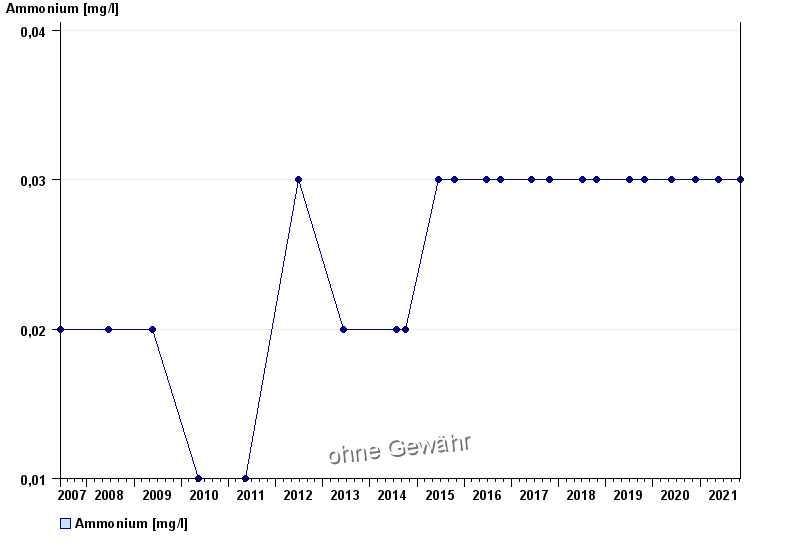
| Date | Ammonium [mg/l] |
|---|---|
| 10.11.2021 | < 0.03 |
| 25.05.2021 | < 0.03 |
| 24.11.2020 | < 0.03 |
| 25.05.2020 | < 0.03 |
| 28.10.2019 | < 0.03 |
| 01.07.2019 | < 0.03 |
| 22.10.2018 | < 0.03 |
© Bayerisches Landesamt für Umwelt 2024