
- Start >
- Groundwater >
- Chemistry >
- Bayern >
- 4110843000018 >
- Chart of total period

Chart of total period 4110843000018
Data from 08.05.2007 to 29.07.2024
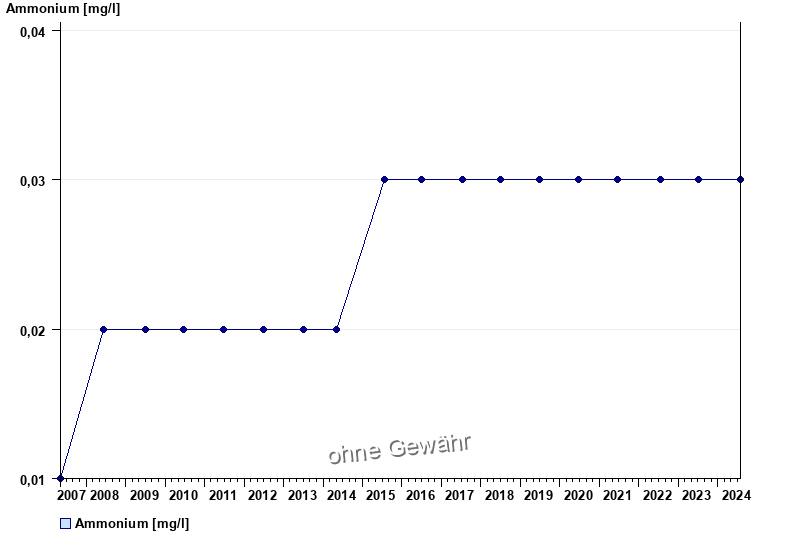
| Date | Ammonium [mg/l] |
|---|---|
| 29.07.2024 | < 0.03 |
| 06.07.2023 | < 0.03 |
| 18.07.2022 | < 0.03 |
| 14.06.2021 | < 0.03 |
| 23.06.2020 | < 0.03 |
| 24.06.2019 | < 0.03 |
| 27.06.2018 | < 0.03 |
© Bayerisches Landesamt für Umwelt 2025