
- Start >
- Groundwater >
- Chemistry >
- Bayern >
- 4110673100012 >
- Chart of total period

Chart of total period 4110673100012
Data from 13.06.2007 to 26.10.2021
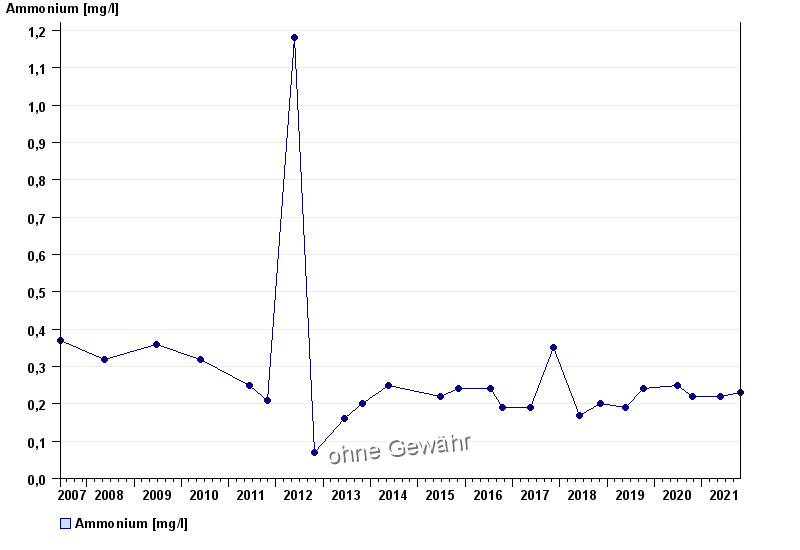
| Date | Ammonium [mg/l] |
|---|---|
| 26.10.2021 | 0.23 |
| 27.05.2021 | 0.22 |
| 21.10.2020 | 0.22 |
| 01.07.2020 | 0.25 |
| 08.10.2019 | 0.24 |
| 20.05.2019 | 0.19 |
| 14.11.2018 | 0.2 |
© Bayerisches Landesamt für Umwelt 2024