
- Start >
- Groundwater >
- Chemistry >
- Bayern >
- 4110623800020 >
- Chart of total period

Chart of total period 4110623800020
Data from 19.06.2007 to 17.06.2021
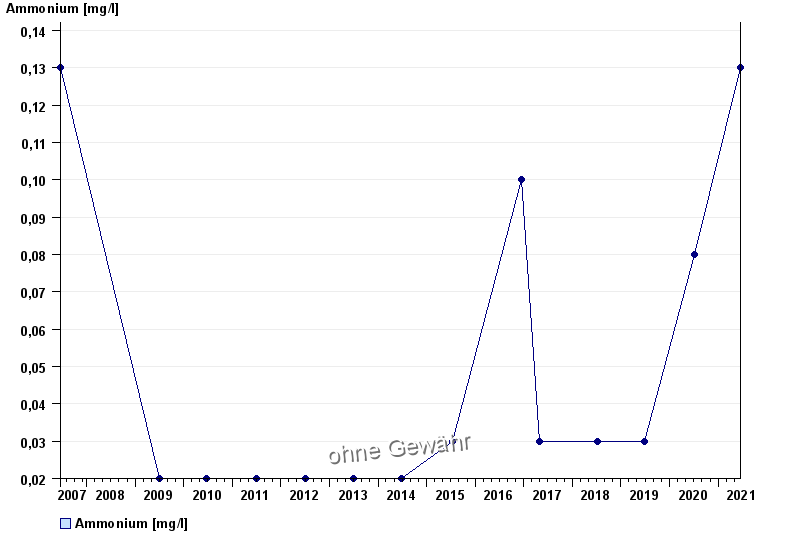
| Date | Ammonium [mg/l] |
|---|---|
| 17.06.2021 | 0.13 |
| 09.07.2020 | 0.08 |
| 25.06.2019 | < 0.03 |
| 10.07.2018 | < 0.03 |
| 26.04.2017 | < 0.03 |
| 13.12.2016 | 0.1 |
| 15.07.2015 | < 0.03 |
© Bayerisches Landesamt für Umwelt 2024