
- Start >
- Groundwater >
- Chemistry >
- Bayern >
- 1230593800067 >
- Chart of total period

Chart of total period 1230593800067
Data from 18.06.2007 to 11.06.2013
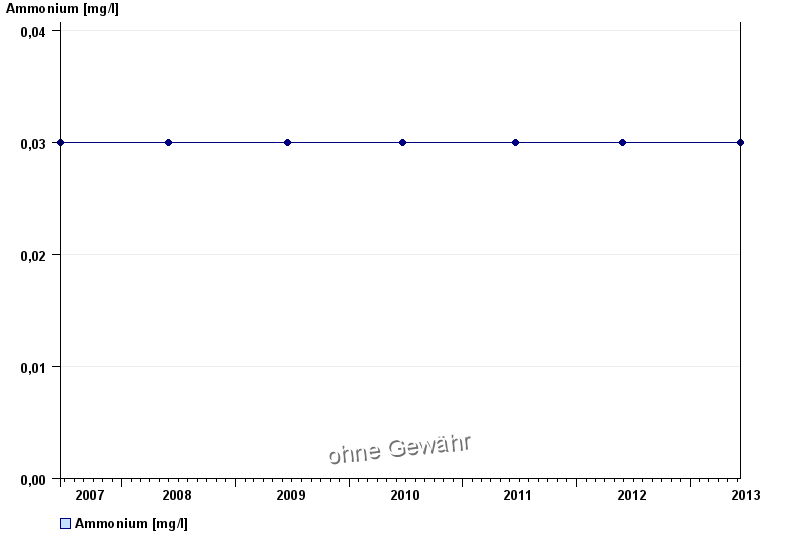
| Date | Ammonium [mg/l] |
|---|---|
| 11.06.2013 | < 0.03 |
| 29.05.2012 | < 0.03 |
| 20.06.2011 | < 0.03 |
| 22.06.2010 | < 0.03 |
| 16.06.2009 | < 0.03 |
| 29.05.2008 | < 0.03 |
| 18.06.2007 | < 0.03 |
© Bayerisches Landesamt für Umwelt 2025