
- Startseite >
- Seen >
- Wasserstand >
- Iller - Lech - Bodensee >
- Rottachsee >
- Jahresgrafik

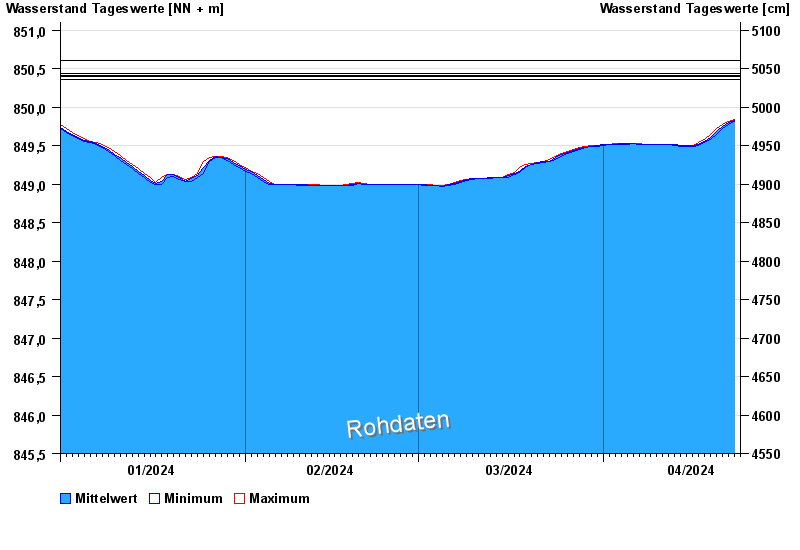
Jahresgrafik Rottachsee / Rottachsee
Wasserstand vom 01.01.2024 bis zum 23.04.2024
- 02.06.2013 Wasserstand: 850,60 m ü. NN
- 22.07.2007 Wasserstand: 850,44 m ü. NN
- 24.08.2005 Wasserstand: 850,41 m ü. NN
- 06.08.2010 Wasserstand: 850,40 m ü. NN
- 12.08.2002 Wasserstand: 850,36 m ü. NN
Linien: keine | Hauptwerte | Meldestufen | mittlerer Seespiegel | Hochwassermarken | historische Ereignisse
| Datum | Mittelwert [m ü. NN] | Maximum [m ü. NN] | Minimum [m ü. NN] |
|---|---|---|---|
| 23.04.2024 | 849,83 | 849,84 | 849,81 |
| 22.04.2024 | 849,80 | 849,81 | 849,78 |
| 21.04.2024 | 849,75 | 849,78 | 849,72 |
| 20.04.2024 | 849,69 | 849,72 | 849,65 |
| 19.04.2024 | 849,61 | 849,65 | 849,58 |
| 18.04.2024 | 849,56 | 849,58 | 849,54 |
| 17.04.2024 | 849,52 | 849,54 | 849,50 |
© Bayerisches Landesamt für Umwelt 2024